Object Hierarchy Chart

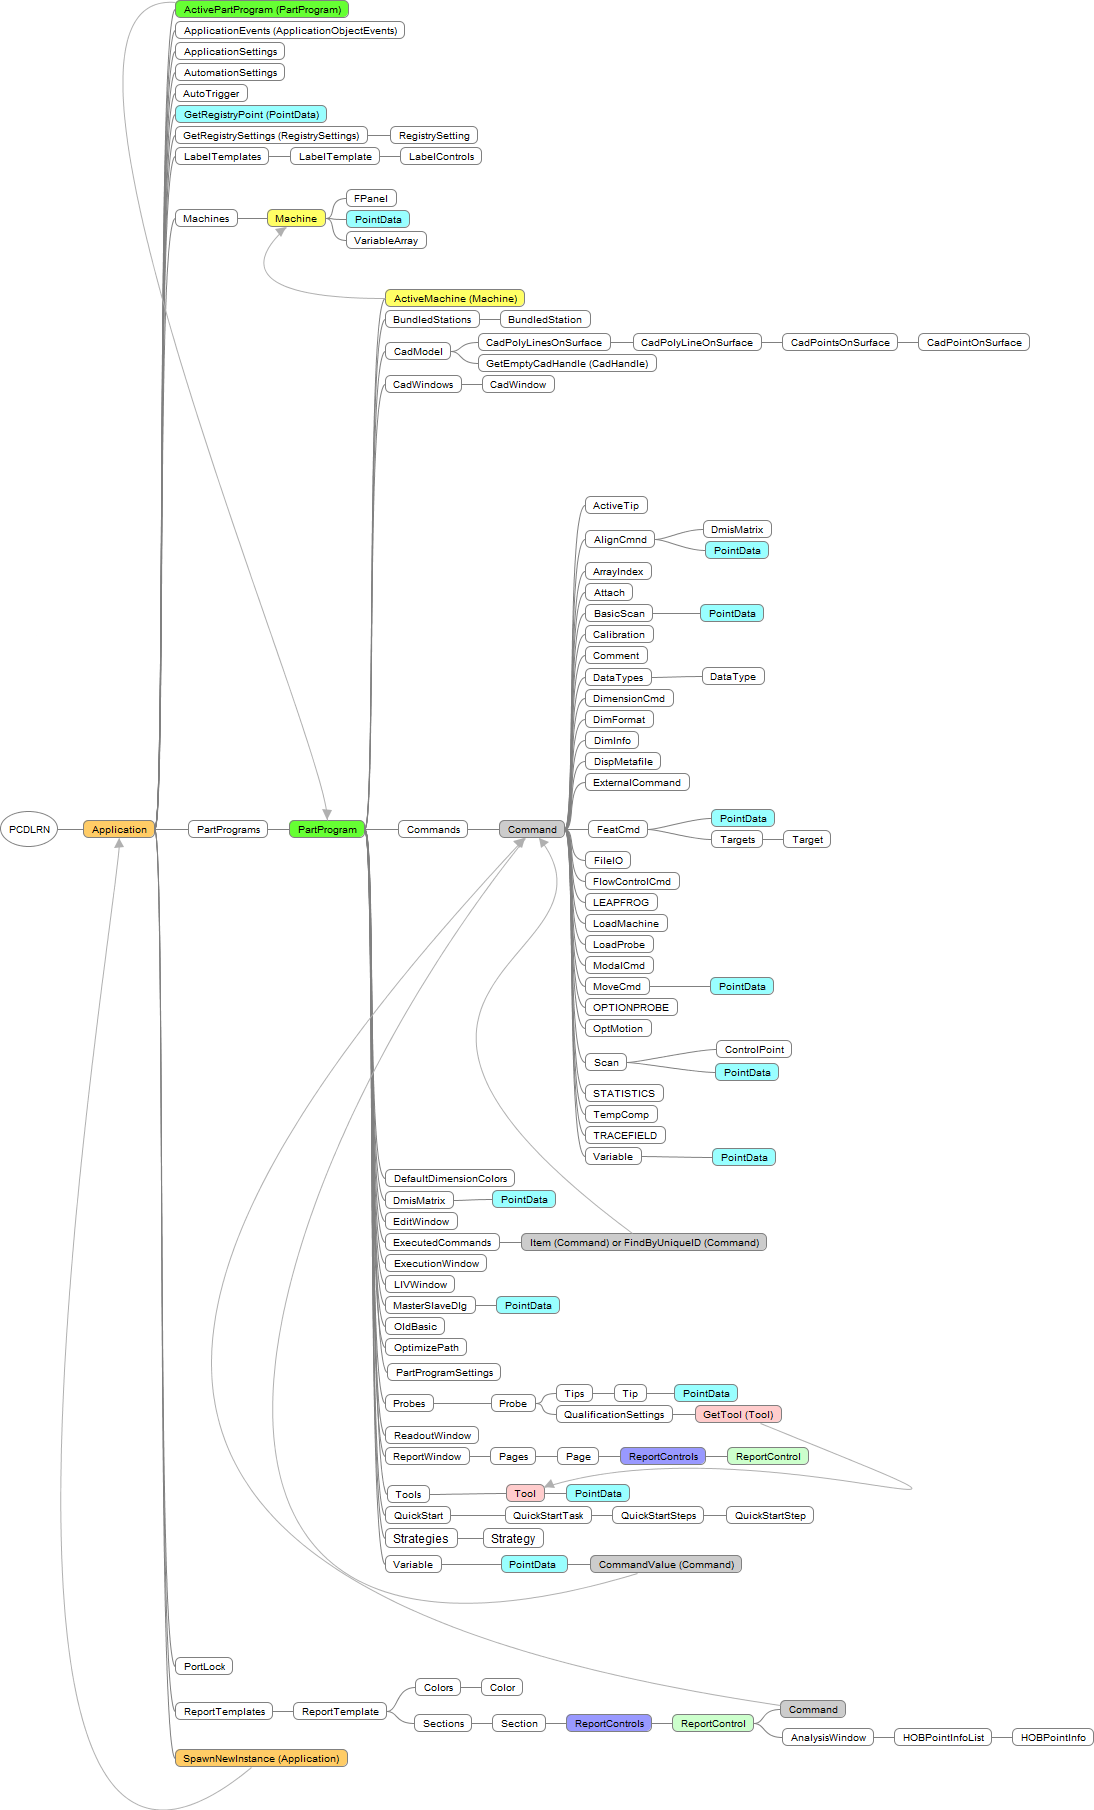
The chart below shows the hierarchal relationship (starting with PCDLRN and moving from left to right) of all the objects in PC-DMIS's type library. You will find this chart useful when coding your scripts.

Additionally, under the chart you will see a Textual Object Heirarchy if you want to search for an item using the find functionality in your browser:

Imagemap ReportTemplate GetTool (Tool) GetTool (Tool) GetTool (Tool) Command GetTool (Tool) GetTool (Tool) CadPolyLinesOnSurface ApplicationSettings CadModel CadModel Application Section Item (Command) or FindByUniqueID (Comman ... ReportControls MasterSlaveDlg FileIO ApplicationEvents (ApplicationObjectEven ... ApplicationSettings ActivePartProgram (PartProgram) RegistrySetting GetRegistrySettings (RegistrySettings) LabelTemplates LabelTemplate LabelControls GetRegistryPoint (PointData) VariableArray PointData FPanel Machine Machines FlowControlCmd LEAPFROG ActiveMachine (Machine) CadWindow CadPointOnSurface CadPolyLineOnSurface CadPolyLinesOnSurface CadWindows CadModel CadPointsOnSurface LoadProbe LoadMachine AlignCmnd ActiveTip DmisMatrix PointData ArrayIndex Attach PointData BasicScan DataTypes Comment Calibration DataType DimensionCmd DimFormat ExternalCommand DispMetafile DimInfo MoveCmd PointData ModalCmd OPTIONPROBE OptMotion Target Targets PointData FeatCmd Command Commands PartProgram PartPrograms Application ControlPoint Scan PointData STATISTICS TRACEFIELD TempComp Variable PointData PointData PointData Item (Command) or FindByUniqueID (Comman ... MasterSlaveDlg ExecutedCommands QualificationSettings EditWindow PartProgramSettings OldBasic Probes Tip GetTool (Tool) DmisMatrix Tips Probe PointData Page Pages ReportWindow ReportWindow PointData Tool Tools QuickStartStep QuickStartSteps QuickStartTask QuickStart CommandValue (Command) PointData Variable Sections ReportTemplate Color Colors ReportTemplates ReportTemplates ReportControls


Textual Object Hierarchy

(Back to Object Hierarchy Chart)

PCDLRN

(Back to Object Hierarchy Chart)