).
). Once you define a cross section, each section can be individually displayed in a 2D view. The view is normal to the cross section. Any annotation points created on the cross section appear in the 2D view.
To view the cross sections in 2D, from the Graphic
Modes, Mesh, Pointcloud, or QuickCloud
toolbar (View | Toolbars), click the 2D
Section Slide Show button ().
For more information on the 2D Section Slide Show, see the "Cross Section Slide Show" section of the "Show and Hide Cross Section Polylines" topic.
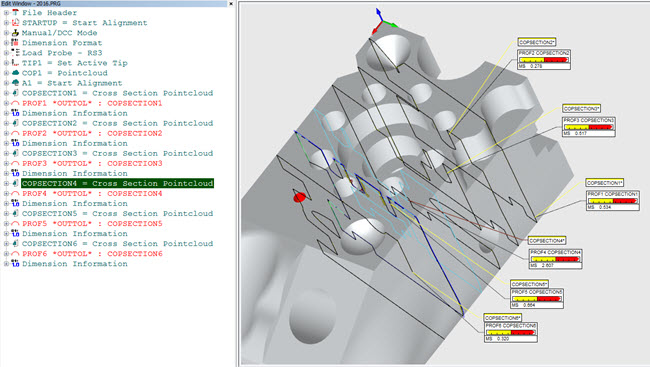
 How
to view the cross sections in 2D from the Edit window.
How
to view the cross sections in 2D from the Edit window.
When in 2D view, the Cross Section Graphic Control toolbar is available.

Example of a section view normal to the cross section
As you hover and move the cursor over the cross section in the Graphic Display window, the labels appear and update in real time. Click any point on the cross section when in 2D view to create an annotation label for that location.
The Cross Section Graphic Control toolbar is a floating toolbar that you can position anywhere in the Graphic Display window.

Cross Section Graphic Control toolbar
The buttons from left to right perform these functions:
Show/Hide annotations - Shows and hides the annotations.
Show/Hide distance gages - Shows and hides the distance gages.
Show/Hide 2D radius gages - Shows and hides the 2D radius gages.
Show/Hide nominal polylines - Shows and hides the nominal polylines.
Show/Hide measured polylines - Shows and hides the measured polylines.
Show the previous 2D Section - From the currently-selected cross section in the Edit window, each time you click this button, the software displays the previous cross section through to the first cross section.
Show the next 2D Section - From the currently selected cross section in the Edit window, each time you click this button, the software displays the next cross section through to the last cross section.
Click the Show the previous 2D Section or the Show the next 2D Section button to toggle backward or forward to view the cross sections in a slide show pattern. For details, see the "Cross Section Slide Show" section in the "Show and Hide Cross Section Polylines" topic.
More:
Creating a Cross Section along a Curve
Creating a Cross Section between 2 Points
Show and Hide Cross Section Polylines