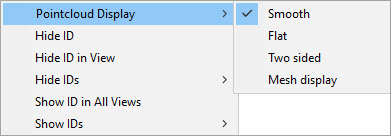
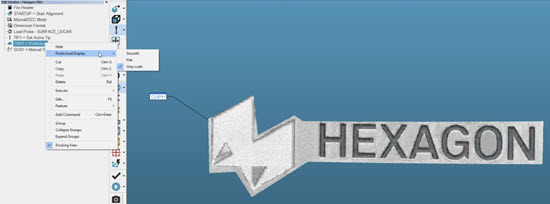
You can set the graphical representation of a selected pointcloud (COP). PC-DMIS stores the setting when you save the measurement routine. To do this, right-click a COP in the Edit window, or right-click the COP label in the Graphic Display window to view the Pointcloud Display menu options:

The Pointcloud Display menu for Pointcloud data without intensity values
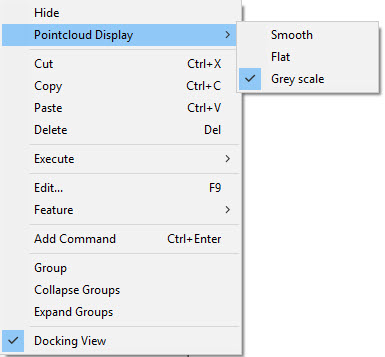
The Pointcloud Display menu for Pointcloud data with intensity values
The Pointcloud Display options are:
Smooth - This option provides a shaded appearance using the defined COP color.
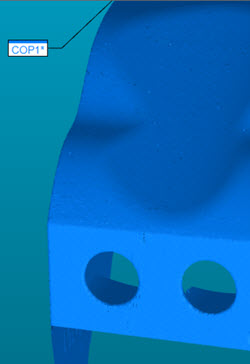
Example of the Pointcloud Display set to Smooth
Flat - This option shows the COP in a non-shaded graphical view. This selection requires the least amount of graphical memory.

Example of the Pointcloud Display set to Flat
Two sided - This option shows a shaded appearance where the scanned side of the part is the defined COP color, and the non-scanned side is the contrasting color. If your pointcloud data contains intensity values, PC-DMIS replaces this option with the Grey scale option.
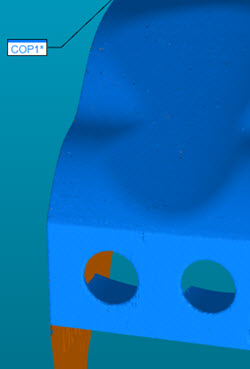
Example of the Pointcloud Display set to Two sided
Grey scale - This option replaces the Two sided option if the data contains intensity values (for example, scanned pointcloud data using the ATS600 scanner). This option is also available if you import a pointcloud which contains intensity values. When you select this option, PC-DMIS colors the pointcloud display in the Graphic Display window in grey scale.
Mesh display - This option allows the software to show the pointcloud as a mesh display.
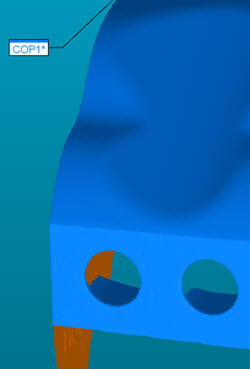
Example of the Pointcloud Display set to Mesh display
The Mesh display option is only available if you have the Mesh license and you scanned the COP using the Mesh display option (Portable only). For details, see "Pointcloud Display Area".
Mesh display is a display setting only. The underlying data is a pointcloud.
If you edit the COP (for example, if you perform any COP operation on the pointcloud), the mesh display is lost, and the display reverts to points.