The Q-DAS Chart command tells PC-DMIS to generate a process chart with both Q-DAS and PC-DMIS data. The command grabs data from a Q-DAS database and combines that data with the results of the PC-DMIS current execution into a process chart on your report.
This does not insert the results of the current execution into the Q-DAS database. You need to use a STATS/ON command to do that. For more information on that, see "Sending Statistics to a Q-DAS Database".
This topic assumes that you have a Q-DAS server installed and data exists in the Q-DAS database. For information on how to setup Q-DAS, see your Q-DAS installation and setup documentation.
Procedure
Ensure that your computer can connect to the Q-DAS web server that communicates with the Q-DAS database.
You can get that connection information from whomever installed and configured Q-DAS in your organization.
From the Q-DAS Configurator (Operation | Q-DAS | Open Configurator), choose Setup | Q-DAS Webservice, and type the link to the web server.
In PC-DMIS, open a measurement routine that has already sent data do the Q-DAS database.
In the Edit window, make sure to mark the dimension for execution.
Click somewhere under the dimension command.
Choose Insert | Statistics | Q-DAS Chart | Individual to insert the Q-DAS Chart command.
Modify the Q-DAS Chart command with the characteristic ID and the number of transactions. You can do this through a dialog box:
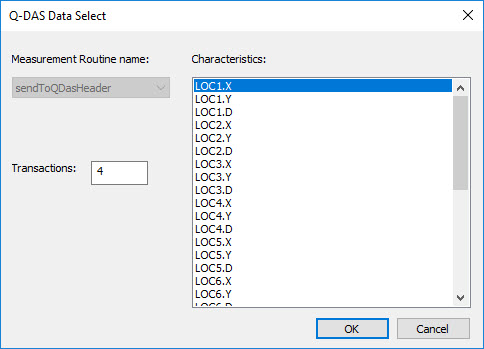
Press F9 on the command to open the Q-DAS Data Select dialog box.
From the dialog box, in the Transaction box, type how many transactions you want in your chart.
From the Characteristics list, choose the characteristic you want to use.
Click OK to update the command in the Edit window.
Choose File | Execute to execute the measurement routine.
You can choose Insert | Statistics | Q-DAS Chart | Individual to insert the command into the Edit window. The command in the Edit window looks like this:
Q_DAS_CHART/TYPE = TOG1, CHARACTERISTIC/TOG2,LAST=TOG3
TOG1 = This field shows the chart type. PC-DMIS supports only INDIVIDUAL.
TOG2 = This fields determines the characteristic ID that you want to report in the chart. For example, if this field is LOC3.X, it means you want to report the X axis from the Location dimension with an ID of LOC3.
TOG3 = This field determines the number of transactions. The command uses the current execution as one of the transactions. This value must be at least two, because it needs to grab at least one transaction from the database along with the current execution.
For example, suppose the Q-DAS database has 25 transactions. If you type a value of 5 for TOG3, the command pulls four transactions from the database and combines it with the current execution for a total of five transactions. If you type a value of 25, the command grabs 24 transactions from the database and adds it to the current execution for a total of 25. If the value is more than the number of transactions in the database, the command grabs all the transactions from the database.
The Q-DAS Chart command must reside below the dimension referenced in the characteristic ID.
Adding Characteristics
You can manually type the characteristic ID into the command's LAST= field, or you can select the command, F9, and then choose the characteristic from the Q-DAS Data Select dialog box.

Q-DAS Data Select dialog box
Measurement Routine name - This item shows the name of the measurement routine. PC-DMIS takes this value from the header information in the Edit window. You cannot edit this here.
Characteristics - This list shows the characteristics for all dimensions that are above the current position of the cursor in the Edit window.
Transactions - This box contains the number of transactions to use in the chart. One of these transactions is the current execution. The others come from the Q-DAS database. This corresponds to the TOG3 value in the command description above.
It may take a few seconds to talk to the server and open the dialog box.
Showing the Chart in the Report
If you use a report template, and it has a TextReportObject, the chart appears in the report. If you don't see it, you may need to access the Report dialog box, and mark the Show Screen Captures check box. For information, see "Edit Text Reporting" in the "Reporting Measurement Results" chapter.
If you use a custom report, you can also drag and drop the chart from the Edit window's Summary mode directly into the custom report. For information, see "Creating Custom Reports" in the "Reporting Measurement Results" chapter.
A sample chart appears in the report as a bitmap image that looks like this:

Troubleshooting
"Connection failed" Error
This means PC-DMIS cannot talk to the web server that passes information from the Q-DAS database. You can define the web server from the Q-DAS Configurator (Operation | Q-DAS | Open Configurator). When the Q-DAS Configurator opens, from the Q-DAS Configurator, choose Setup | Q-DAS Webservice. For more information, see the "Q-DAS Configurator" documentation.
"[<Name>] was not found"
This means PC-DMIS cannot locate the routine name in the Q-DAS database (<Name> represents the name of your measurement routine). You need to first send data to the Q-DAS database through a STATS/ON command.
"Characterisic <ID> ...." Errors
One of these error types means that PC-DMIS cannot locate the characteristic ID in your measurement routine. The characteristic was either not found, was not marked for execution, or was skipped during execution. Make sure this ID gets executed.