
In this Topic Hide
Introduction to Geometric Tolerances and Feature Control Frames
Conceptual Process for Evaluating Geometric Tolerances
Specification Versus Verification
Recommended Steps for a Careful Study
A manufactured part has functional requirements. These requirements often involve the shapes, sizes, orientations, and locations of the features—they are geometric requirements. The features must meet the geometric requirements either alone or with other features.
Geometric tolerances communicate the geometric requirements precisely. A drawing or CAD model specifies geometric tolerances in these ways:
Feature control frames (ASME Y14.5)
Tolerance indicators (ISO 1101)
Terminology Note: ASME feature control frames and ISO tolerance indicators appear and function similarly to each other. Because of this, we use the term "Feature Control Frame" to refer to either one. We also use the term "Geometric Dimensioning and Tolerancing Standard" (or "GD&T Standard" for short). This term refers to both the standards involved (ASME Y14.5 or ISO 1101) even though the ISO term is “geometrical product specifications.”
A Feature Control Frame (FCF) uses numbers and symbols in rectangular boxes, like this:
While PC-DMIS can verify geometric tolerances according to any standard, it can most easily do this when tolerances are written according to these specific standards:
ASME Y14.5 2009/2018
ASME Y14.5.1 2019
ISO 1101 : 2012/2017
ISO 5459 : 2011
ISO 5458 : 1998
ISO 14405-1 : 2010
ISO 17450-3 : 2016
ISO 2692 : 2014
ISO 1660 : 2017
Terminology Note: For brevity, we refer to the ASME group of standards as "ASME Y14.5" and the ISO group of standards as "ISO 1101".
A geometric tolerance always includes these items:
One or more toleranced features
A tolerance zone for each toleranced feature
Zero or more datum features. These constrain how toleranced features may be optimized into the tolerance zone or zones.
When you evaluate a geometric tolerance, you need to know all the basic dimensions (ASME Y14.5) or the theoretically exact dimensions (ISO 1101). These are the nominal relationships between all the features in question. This means all the features must have correct nominals (THEOs). If these are incorrect, PC-DMIS can evaluate the geometric tolerances incorrectly.
The easiest way to ensure the nominals are correct is to construct the part program from the CAD model.
The ASME and ISO standards families for GD&T are specification standards. Geometric tolerances are one type of specification. The standards define the specifications—what the tolerances mean—but they do not tell you how to verify that your part meets its specification.
The specification world deals with perfect information. The specification is defined in terms of the entire actual surface. There are infinite points with zero measurement uncertainty.
The verification world deals with imperfect information. The verification is defined in terms of the measured points. These are finite points with measurement uncertainty. When you choose math options, your goal is to make the verification math yield a result as close as possible to the specification. In other words, the specification is what you're trying to measure (the "measurand"), while the measurement is your best approximation to the specification. Sometimes the best verification math is very different than the specification math.
Because of this difference between specification and verification, datums and tolerance values usually come in pairs. For example, there are both actual datums and measured datums, as well as actual tolerances and measured tolerances:
Actual datums and actual tolerance values are defined by the specification using perfect information about the actual surface.
Measured datums and measured tolerance values are approximations to actual datums and tolerance values based on measured data.
Unfortunately, there are no verification standards for GD&T, so it is very difficult to meaningfully compare different software packages that are intended to evaluate the same specification. Different software packages use different algorithms to approximate the actual datums and tolerance values, so they get different measured datums and different measured values.
For example, the actual straightness of a line is based on perfect information about the surface. The measured straightness is based on the measured points. The measured straightness can be smaller than the actual straightness if the actual high and low points are not measured. Alternatively, the measured straightness can be larger than the actual straightness if the measured points' uncertainty is large.
Below is an illustration of a surface's actual straightness. The entire actual surface cross section must lie between two parallel lines, where the distance between the lines is minimal. The distance between the lines is the actual value.
Below is an illustration of a surface's measured straightness. The measured points on the surface cross section must lie between two parallel lines. The distance between the lines is the measured value. The thin solid line represents the actual surface (perfect information), while the small dots represent the measured surface points (imperfect information). In this case, too few points were measured, so the measured value is smaller than the actual value.

In the specification world, ISO 5459 : 2011 tells
us that a primary datum plane, is defined as a constrained min-max plane.
This plane is external to the material. It contacts at least one high
point, and it minimizes the deviations to the low points (after filtering
the surface).
In the verification world, if we’ve measured our points densely (lots of
points) and we have much lower measurement uncertainty than the form error,
then the best algorithm in this verification situation is a constrained
min-max algorithm. That algorithm ensures our measured datum plane matches
the specified datum plane as closely as possible. On the other hand, in
the verification world, if our measured points have larger measurement
uncertainty than the form error (this is common), then we should probably
use a plain (unconstrained) least-squares algorithm. This is because almost
all of the measured form error is really measurement error, and so contacting
the high points is going to put the datum plane way off the actual surface.
In this case, plain least squares is the better choice.
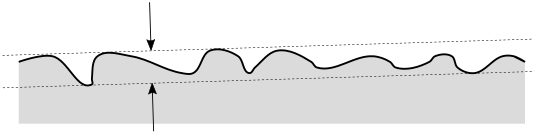
Below is an example of a primary datum plane, containing form error. The
actual datum specified by ISO 5459 : 2011 is shown by the thin straight
line.
Below is an example of that primary datum plane, which has been measured
by a sensor where each measured point has large measurement uncertainty.
The solid wavy line represents the actual surface. If you use the specification
math (constrained min-max after void filtration), the measured datum is
very far from the actual datum, as shown by the thin straight line.

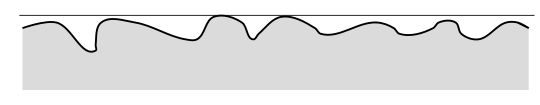
Below is an example of the same primary datum, with the same measured points,
but using plain (unconstrained) least-squares math. This measured datum
is a much better approximation to the actual datum.

Frequently, you may need to use different algorithms during verification than the specification uses. Because of this, geometric tolerance commands give you math options that allow you to control what algorithms are used for the verification. You may find it difficult to choose the best math options. The only way to really be certain you’ve chosen the best math options is to do a careful study.
Take several actual parts that represent the variety of errors the manufacturing process can produce.
Densely measure all the parts with lots of cross sections, and use equipment that offers much less measurement uncertainty than the form error.
Choose math types that closely approximate the specification.
Measure the same parts in the way you expect to actually measure your parts in production. Use the same sensors and measurement strategies you plan to use.
Choose a wide variety of math types, and compare how well those math types approximate your dense-and-high-accuracy measurements. That lets you pick the math type combination that most closely approximates the specification.
Typically, the best math option depends on the ratio between your measurement uncertainty and your form error. If the measurement uncertainty is much larger than the form error, then you can’t measure the real form error with your sensor anyway, and it’s best to choose something simple like plain least squares for the datum and feature math types. On the other hand, if the measurement uncertainty is much less than the form error, then it’s best to choose math types that closely approximate the specification.
The discussion of how to pick math types is completely separate from the question of whether your sensor is able to verify your specifications. That complex topic will not be discussed in this documentation. However, it’s critical that verification engineers choose sensors and measurement strategies that are accurate enough, with the chosen math types, to verify the specification.
There is a difference between considered features and toleranced features.
A considered feature is a measured surface that represents the controlled surface. You measure the considered features in your measurement routine. A considered feature is, in the language of ISO 1101, a measurement of a real integral feature. When you use the geometric tolerance command, you choose the considered features for each tolerance.
The toleranced feature is what goes inside the tolerance zone. The tolerance feature is sometimes the considered feature surface. Sometimes it is something derived from the considered feature surface. For example, it might be the axis of the unrelated actual mating envelope (ASME Y14.5) or the extracted median line (ISO 1101). For more information, see "Deriving the Toleranced Feature".
The actual evaluation of a geometric tolerance then consists of several phases:
Measurement of the considered features’ surfaces and datum features’ surfaces
Computation of the datums in their hierarchical order of precedence
Production of the toleranced feature from the considered feature as necessary
Evaluation of each toleranced feature within its tolerance zone. This is subject to the datums' constraints.
Reporting the evaluated result
In most cases, you are responsible for phase 1 of this evaluation process. The PC-DMIS geometric tolerance command handles the other phases in a way that complies with ASME Y14.5 or ISO 1101.
Because you are responsible for phase 1 of this evaluation process, you must measure the surfaces densely enough, and with enough cross sections, so that the measured datums and measured values can closely approximate the actual datums and actual values. This means you must thoroughly understand the specifications, the strengths and weaknesses of your measurement equipment, and the types of errors your manufacturing process can produce.
PC-DMIS 2020.2 introduced the geometric tolerance command. Before this, PC-DMIS had some FCF capabilities that supported older standards and that were more limited.
Terminology Note: This documentation refers to the old capabilities as "XactMeasure". This is because in prior versions of PC-DMIS, the feature control frame dialog box had the text “XactMeasure” in its title bar. The current geometric tolerance command has the text “Geometric Tolerance”.
Several comparisons to past practice are in this documentation. They compare the XactMeasure capabilities and behavior to the geometric tolerance command’s capabilities and behavior.