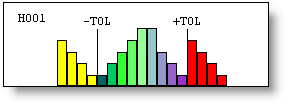

The DimensionHistogram object displays, in a histogram bar-graph format, the number of deviations within each of the different tolerance zones.

A Sample Histogram
When a dimension only has a single tolerance value, such as a form dimension, PC-DMIS displays the tolerance band as a range and not in a fixed location. PC-DMIS will not display -TOL or +TOL in the resulting histogram but will instead show the heading "TOLERANCE ZONE" at the top and include a location for the mean value like this:

A Sample Histogram with a Single Tolerance
Inserting the DimensionHistogram Object
Use the Label Template Editor for a new or existing label template and then add and size the DimensionHistogram object so that it appears vertically or horizontally as desired in your label template editor's display area. Next, use the Rule Tree Editor dialog box for a new or existing report template to specify under what conditions (for what dimensions) PC-DMIS will call and display that label template. See the "About the Rule Tree Editor" topic in this chapter for information on how to do this.
DimensionHistogram objects are available only for dimensions that are directly calculated using the individual hits of their features, such as Location, Position, and Keyin dimensions.
Changing Histogram Colors
To see how these tolerance zones are defined, or to change the colors that represent each tolerance zone, see "Editing Dimension Colors" in the "Editing the CAD Display" chapter.
Properties
Properties specific to this object are listed below.
HatchStyle
Same as described in the "Ellipse Object"
topic.