Report dialog box
The Report dialog box (available with template reporting) lets you determine the overall information that PC-DMIS includes in the Report window and how it displays that information.
You can access this dialog box in these ways:
Right-click on any text-only
reporting text or white space at the end of the Report window and
then select the Edit Object
menu item when the shortcut menu  appears.
Press Shift and then right-click on any label object in the Report window, and then select the Edit Object menu item.
The following check boxes let you show or hide various items:
Show
Features
This option displays all feature measurements in your measurement routine.
If you are using the default report template, textonly.rtp, and your measurement routine measures a feature with more than the minimum number of points, it also displays a form plot of the feature.
Show
Alignments
This option shows alignment changes as they occur during the measurement
routine. It will display all alignment changes that occur in the dimension
or feature lists.
Show
Comments
This option shows any comments that have been added to the measurement
routine. (For information on comments, see "Inserting
Programmer Comments" in the "Inserting
Report Commands" chapter.)
Show
Header / Footer
This option displays a header and footer in your report by applying the
label template defined in the File Header rule
of the Rule Tree Editor. By default this is
the FILE_HEADER.LBL label template that ships with PC-DMIS.
Show
Screen Captures
This option displays any screen capture graphics related to DISPLAY/METAFILE
and ANALYSISVIEW commands in the report. (For information
on screen captures, see "Using
Screen Captures of the Graphic Display Window" in the "Editing
the CAD Display" chapter.)
The Header after Print command area is enabled if you mark the Show Header / Footer check box. This area determines how PC-DMIS handles a report header after a PRINT/REPORT command. The list in that area contains these options:
Normal
PC-DMIS generates only one report header. It does not generate a new report
header even if you execute a measurement routine with a PRINT/REPORT
command in any kind of loop. (For information on the different kinds of
loops, see the "Branching
by Using Flow Control" chapter.)
Always
PC-DMIS always generates a new report header for any next report output
that follows the PRINT/REPORT command.
If File
Header executed
PC-DMIS generates a new report header only if you executed the File Header
command block before the PRINT/REPORT
command. The File Header is the command block in the Edit window that
has the part name, revision number, serial number and so on. (This shows
as "File Header" in Summary
Mode.) By default, the File Header uses the FILE_HEADER.LBL template
during report generation. While you cannot delete the File Header command
block, you can skip over it with certain partial execution options, such
as Execute from cursor. (For more information
on partial execution, see "Executing
Measurement Routines" in the "Using
Advanced File Options" chapter.)
For more information on the PRINT/REPORT command, see "Inserting a Print Command" in the "Inserting Report Commands: Introduction" chapter.
The Dimensions area allows you to control the display of dimensions in your reports. To display dimensions, select the Show check box. Once selected, the other items in this area become available for selection. These include:
All
Selecting this option acts just as if you had selected both the Out
of Tolerance Only and Dimensions Outside Limits
options.
Out of
Tolerance Only
If this option is marked, PC-DMIS will only show the out of tolerance dimensions.
("Show Dimensions" must be ON.)
This option is only available when you select Show Dimensions and deselect Show Dimensions Outside Limits.
Dimensions
Outside Limits
If you select this option, PC-DMIS will only show the dimensions that lie
outside the percentage of the tolerance zone.
When you select the Show Dimensions Outside Limits check box, the tolerance percentages will become editable, allowing one percentage for unilateral tolerances and an upper and lower percentage for bilateral tolerances.
The tolerance zone can be considered as a range between 0 and 100 percent (similar to how dimension colors are applied to tolerance zone regions or how the colored bar graphs are drawn at the end of dimensions). The lower limit (nominal - minus tol) corresponds to 0% and the upper limit (nominal + plus tol) corresponds to 100%. Consider the following chart where A, on the center of the chart, represents the nominal value:
Chart
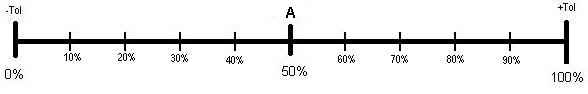
Dimensions that have deviations outside the tolerance zone will either be less than zero or greater than one hundred percent.
For a unilateral dimension (like roundness, which only has a plus tolerance), the zero deviations are at zero percent, and out of tolerance is anything larger than one hundred percent.
Unilateral Example
Nominal: 0.0000
Measured: 0.0028
Deviation: 0.0028
Plus Tol: 0.0050
Minus Tol: 0.0000
Because this deviation is 56% of the tolerance range, it will be displayed if Unilateral Percentage is less than 56%.
For a bilateral dimension (like distance, which has both a plus and minus tolerance), the zero deviations are somewhere in the middle. If the tolerances are equal, the zero deviations will be at the fifty percent position.
Bilateral Upper Example
Nominal: 3.0000
Measured: 3.0075
Deviation: 0.0075
Plus Tol: 0.0100
Minus Tol: 0.0100
The percentage is calculated using the Lever Rule:
(measured value – lower limit) / (upper limit – lower limit) * 100.
With this data, it would be:
(3.0075-2.9900) / (3.0100-2.9900) * 100. = 87.5%
This dimension will be displayed in the inspection report if the Bilateral Upper Percentage is greater than 87.5%.
Bilateral Lower Example
Nominal: 3.0000
Measured: 2.9925
Deviation: 0.0075
Plus Tol: 0.0100
Minus Tol: 0.0100
The percentage is calculated using the Lever Rule:
(measured value – lower limit) / (upper limit – lower limit) * 100.
With this data, it would be:
(2.9925-2.9900) / (3.0100-2.9900) * 100. = 12.5.%
This dimension will be displayed in the inspection report if the Bilateral Lower Percentage is less than 12.5%.
Use Text
Mode Dimension Reporting
This check box determines whether PC-DMIS uses formatted text (selected)
or uses a graphics table (not selected) for displaying the dimensions.

If PC-DMIS cannot find a specified report template, it will use a template named "default.rtp". This generic template provides you with a basic text-based report. Since default.rtp only supports text-based reporting, clearing this check box will do nothing.