(This item pertains to the Edit Dimension Info dialog box, accessible through Insert | Report Command | Dimension Info.)
The Graph Options area allows for graphical display of the dimension percentage in the Dimension Info box.
No Graph - Select this option if you do not want to display a graph in the Dimension Info box.
Graph Worst Axis - Select this option to display a graph at the top of the Dimension Info box. Only the worst dimension percentage will be used for the graph.
Graph Each Axis - Select this option to display a dimension percentage graph for every axis in the Dimension Info box.
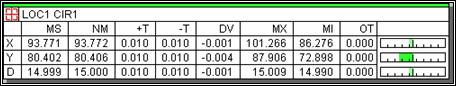
Dimension Info box