
When you select the Graphical check box (or the On option for Location and Position dimensions) for a dimensioned feature (Insert | Dimension), the software provides a graphical view of the dimension in the Graphic Display window.
In that window, PC-DMIS displays the deviation of each dimension's individual probe hit as individual-colored arrows. These arrows, with their colors and directions, indicate the relative size of the deviation, as well as its direction.
For the Position, Concentricity, and Coaxiality dimensions, PC-DMIS shows the position of a feature with one or more arrows. For Symmetry dimensions of width features, PC-DMIS shows the points that make up the center plane.
Command line in the Edit
window:
...GRAPH=BOTH TEXT=OFF MULT=10.00
Consider this example:
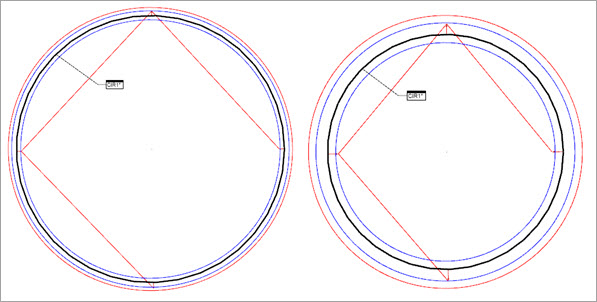
Example of a Location Dimension using Graphical Analysis with a multiplier of 10 (on the left) and 25 (on the right)
The Location example above contains various colored lines, arrows, and circles. The following items describe the colored elements in the example and what they mean:
Black Circle = Shows the nominal circle.
Red Circle = Shows the measured, out-of-tolerance circle.
Blue Circles = Show the tolerance bands.
Colored Lines = Show the lines between hits.
Colored Arrows = Show the hits themselves (the tip of the arrow), the relative size of the deviation for each hit (by the colored arrow), and in the deviation direction (the direction the arrow points).
The colors from the example above are the default dimension colors. They correspond to the colors on the Dimension Colors window. For information, see "Editing Dimension Colors" in the "Editing the CAD Display" chapter.
For information on using the Textual check box to display dimension information for textual analysis, see the example in the "Textual" topic.