This topic discusses the various screen elements available to you within the Vision tab.
PC-DMIS Vision - Live View showing tracker and targets
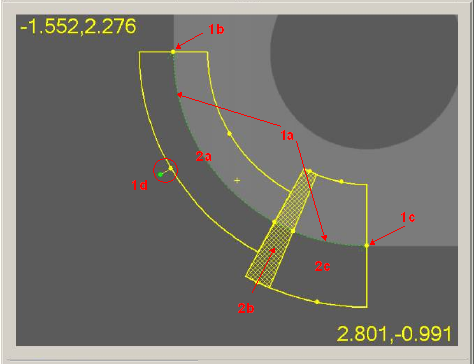
You can alter the elements in the Vision tab by clicking and dragging the handles (green or yellow dots) to the desired location. Handles can control the size, orientation, and start and end angles for the targets.
Tracker: This is the visual user interface to features. In the Circle feature illustrated above, the tracker shows the size of the circle (1a - green dotted circle between the lines of the bright yellow donut), and allows the Start angle (1b), end angle (1c), and orientation (1d - altered by dragging the green dot handle on the end of a line) to be changed.
Target: This is an addressable user interface to point detection. For each region, you can control each Target parameter by clicking in the target, or by dragging the handles. Target parameters are changed in the Hit Targets tab of the Probe Toolbox. In the Circle feature above, the circle has three targets (2a, 2b, and 2c). Each target has slightly different point detection parameters. 2a - configured with a smaller scan width. 2b - configured to detect NO points.
PC-DMIS Vision - Live View showing ROI and FOV coordinates
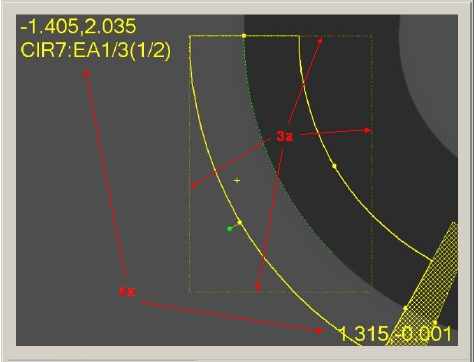
ROI (regions of interest): During run time, PC-DMIS Vision may need to divide a target into pieces so that each piece may fit into the Field Of View (FOV). ROIs are different from Targets in that the target may be bigger than the FOV. There is no user interaction with ROIs except for some visual indicators (3a in the image above. The AutoShutter halo for the upper-left piece outlines the ROI; the target piece that can safely fit into the FOV at this magnification).
FOV Coordinates: At the top and bottom of the screen, the overlay numbers list the X and Y positions for the top left and bottom right corners of the FOV (4a in the image above). When right-clicking and dragging in the Live View, other numbers appear in brackets which show the distance the camera will move. Additional information is given, depending on currently selected Probe Toolbox tab, but in the example above, you can see the feature and target names.
AutoShutter & Auto Compass: According to the Live View Settings, any manual features that you measure with Automatic Targets make use of a technology called "AutoShutter" and "AutoCompass". For more information on AutoShutter and AutoCompass settings found in the Live View Setup dialog box, see "Setting up the Live View"
Auto Compass: This guides the operator to move the stage to get the next feature into the Field Of View. It does this by showing an arrow and a distance to move.
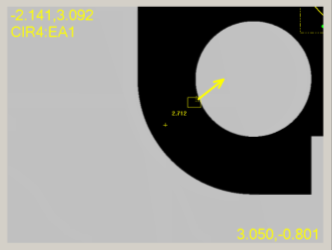
PC-DMIS Vision - Live View showing Auto Compass
You need to move the stage so the entire dashed rectangle box is comfortably within the FOV.
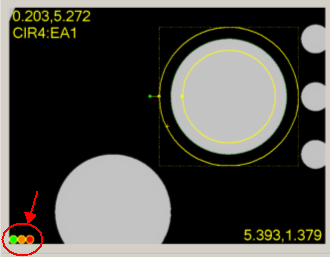
PC-DMIS Vision - Live View showing the colored light countdown
Auto Shutter: Once the target is within the FOV, a colored light countdown is shown on the Live View (see the above image). It checks for stage stability, before automatically performing the edge detection on all targets that are within the current Live View.
If a stage movement is detected during AutoShutter, it discards the points and automatically restarts the countdown to measure again.
Focus Graph: When you execute a Surface Point, Probe Toolbox focus, or SensiFocus, the software draws a graph of the focus data. The software draws it to the right or left of the target as space permits. If there is insufficient room to the side of the target, the software draws the graph in the upper right corner. When you resize the target, move the stage, or press the Shift key, the graph is not drawn.