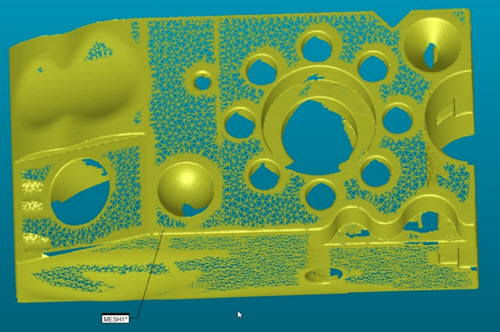
The Pointcloud Display section allows you to select the display setting during a scan. You can choose to show the pointcloud as points or as a mesh display. If you select the Mesh option for scanning, it may allow you to easily see areas which need more data coverage.
You can click the Collapse
button  to hide sections
of the Laser Data Collection Settings dialog
box or click the Expand button
to hide sections
of the Laser Data Collection Settings dialog
box or click the Expand button  to display hidden sections
of the dialog box.
to display hidden sections
of the dialog box.
The Mesh option is only available for Portable systems which have the Mesh license.
Points - This option displays the pointcloud as a set of points.
Mesh - This option shows the laser pointcloud data as a mesh and is only available for Portable systems. You must use the Line Filter when scanning with the Mesh display.
During the scan, PC-DMIS shows the active scan pass as a pointcloud. When the software completes the scan pass, it displays the scan as a mesh. The mesh display is a temporary graphical rendering only.
If you modify the pointcloud (for example, if you perform a Select, Clean or Filter operation), or if you close and then reopen the measurement routine, the mesh display is lost and PC-DMIS displays the data as a pointcloud.
After a scan with the Mesh display option, you can choose to keep only the pointcloud, or you can create a mesh data object. If you choose to create a mesh data object, the software also keeps the original pointcloud.
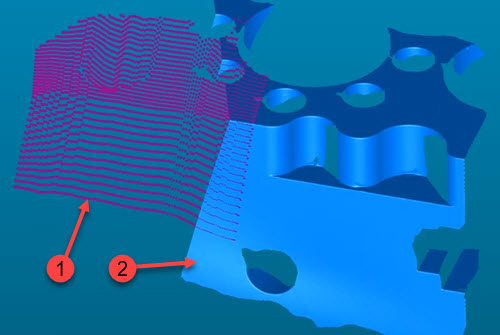
Example showing the active (1) and prior (2) scan passes
The mesh display is relative to the orientation of the laser sensor. While scanning, if the laser sensor orientation changes more than 25 degrees in a single scan pass, the software meshes the collected data and automatically creates a new scan.
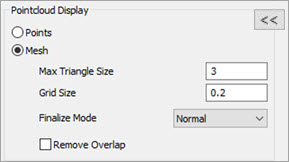
The Max Triangle Size and Grid Size values define the settings for the displayed mesh while scanning.
If you modify the pointcloud (for example, if you perform a Select, Clean or Filter operation), or if you close and then reopen the measurement routine, the mesh display is lost and PC-DMIS displays the data as a pointcloud.
If the scan speed is slow, and more than one point is in a grid square, PC-DMIS keeps the best point.
If the scan speed is fast, it is possible to have a grid square without any data. This may cause gaps in the displayed mesh.
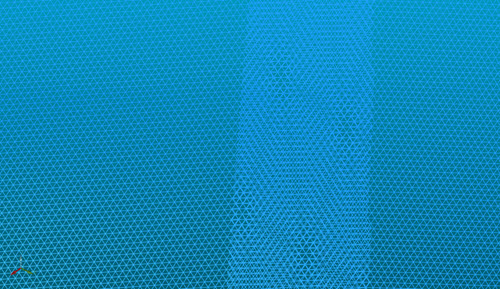
Max Triangle Size - The software uses this value to recognize holes or gaps in the pointcloud data. If the distance between any two points is greater than this value, the software does not create any triangles in that area. If there are hole features on your part, you typically need to set this value to be slightly smaller than the smallest hole. This prevents the mesh display from filling the hole (see the image below).
The default value for the Max Triangle Size is 5 mm. The software converts this to inches if your measurement routine is using that unit. Valid range values depend on the size of the part.
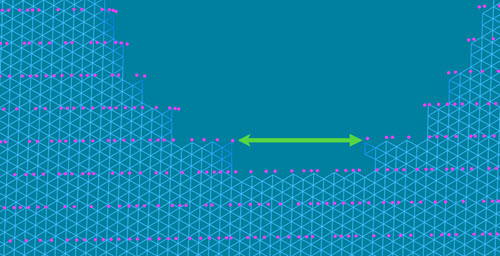
This example shows the distance between the two points is greater than the Max Triangle Size value. PC-DMIS does not create any triangles in this area.
Blue triangles = Mesh Display. The size of the blue triangles is determined by the Grid Size value.
Purple points = Scanned points.
Grid Size - This value defines the size of each triangle in the mesh display grid. This value also affects the display resolution and how refined the mesh appears. When you use a small value, it takes more time to generate the mesh display while scanning, but results in a higher resolution. Be aware that this value is critical; a small value can negatively affect the data collection speed.
Finalize Mode - When you create the mesh with the Create Grid Mesh button on the Portable Scanning Widget toolbar (or the Grid Mesh option on the Mesh dialog box), the software reduces and smooths the mesh display, and removes the overlap. The Finalize Mode option defines the amount of smoothing to apply. The options are:
Precise (least amount of smoothing)
Normal
Smooth (most amount of smoothing)
Remove Overlap check box - When you select this check box, PC-DMIS averages the overlapping areas of multiple scan passes and then blends them together in real-time while the scan takes place. This results in the software removing overlapping data from the mesh display. Note that the pointcloud (COP) object contains all the original scanned points. If the graphical mesh rendering is too slow, you may want to disable this function.
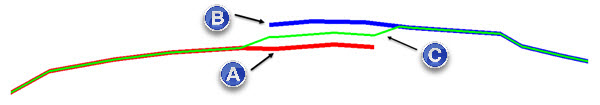
(A) - Scan Pass 1
(B) - Scan Pass 2
(C) - Stitched area
The overlapping scan passes must be within a distance lower than the point density in order to be stitched.

Example of a scan as a Mesh display with the Remove Overlap option selected
During a scan with the Mesh option, if you clear the Stitch Patches check box, the software overlays multiple scan passes on top of each other.
Example of a scan as a Mesh display with the Remove Overlap option NOT selected
Quality Angle - When you select the Mesh option from the Pointcloud Display area and you perform a laser scan, PC-DMIS displays scanned triangles with an angle greater than the Quality Angle setting in the Graphic Display window. The software shows triangles that were scanned with a good sensor-to-surface orientation in green. Triangles outside the Quality Angle value are in red.
You can re-scan the areas with the scan line more perpendicular to the part surface to obtain better quality triangles.
If you select the Remove Overlap option and you re-scan the low-quality areas with a better scanner-to-surface orientation, PC-DMIS may replace the red triangles with the new scanned data.
To enable the display of the low-quality triangles, from the
Portable Scanning Widget toolbar, select
the Low Quality Triangles On/Off button
( ).
).
Use this button to turn the display of the red and green triangles on and off.
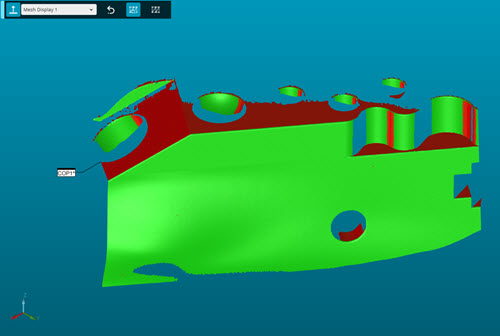
Example showing the display of the red and green triangles when you select the Low Quality Triangles button
For details on the Portable Scanning Widget toolbar, see the "Portable Scanning Widget Toolbar" topic in the PC-DMIS Portable documentation.
If you perform any Pointcloud operation, or if you close and reopen the measurement routine, you lose the Low Quality Triangle red and green display.
Example Workflow: Scan as Mesh Display
Select a mesh profile from the Portable Scanning Widget.
You can also create your own custom mesh profile. For details, see the "Profiles Section" in this documentation.
Scan the part. PC-DMIS displays the COP as a Mesh, but the data is a Pointcloud.
The Mesh display is a temporary graphical rendering. For details on graphical representation of the pointcloud, see "Pointcloud Graphical Representation" in this documentation.
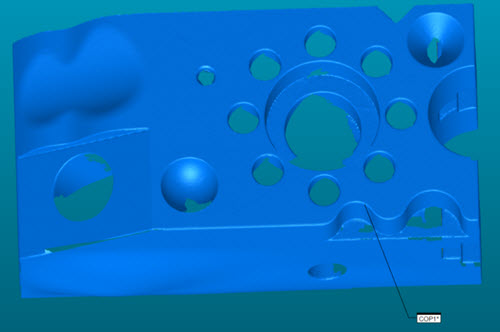
Example of the pointcloud displayed as a Mesh
The next step to create the Mesh object is optional. If you stop at step 2, all the scanned data is a pointcloud.
OPTIONAL: Create the Mesh. PC-DMIS uses the Max Triangle Size, Grid Size, and Finalize Mode options to reduce, smooth, and, if you select the Remove Overlap check box, remove the overlap. It then computes the final Mesh object.
Your measurement routine contains both the original scanned pointcloud (COP) and the Mesh data objects.
More: