You can use the Average airfoil technique to determine the best nominal definition to create a Report file. This is useful for reverse engineering a set of blades to create an average master airfoil definition.
To create a set of Average files, follow these steps:
Click Edit | Flavor File and then select the file to open.
Click the Customization tab.

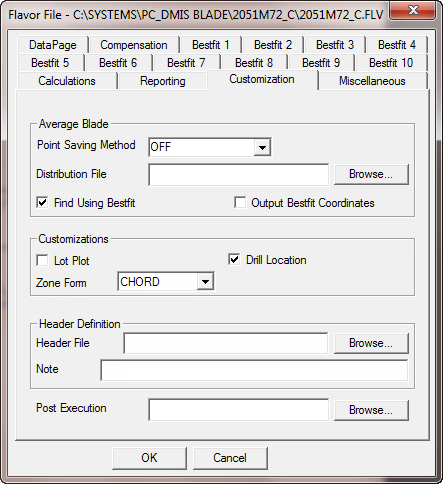
Flavor File dialog box - Customization tab
In the Point Saving Method list, select the method. These methods create Average files (.avg) for each blade inspection.
Nominal Points - The distribution will be identical to the Nominal file distribution. This means that the number of points in the Average file will be equal to the number of points in the Nominal file.
Distribution File - The number of points and their placing on the nominal curve will be as specified in the Distribution file (.dst).
60
1 0.00000
2 0.00050
3 0.00100
...
27 0.44000
...
57 0.99600
58 0.99700
59 0.99900
60 1.00000
An Average file is created in the same format as an .rpt file, but it uses the extension .avg. The nominal points project onto the measured curve to determine the “measured points” that write to the Average file. You can analyze multiple Average files and produce a report that corresponds to the average of multiple runs.
The Find Using Bestfit check box specifies whether a best fit is applied to the measured curve prior to intersecting the points with rays.
For an example of an Average file, see "Average File (AVG)".
Measure one blade multiple times, or measure multiple blades one time each to create Average files. One Average file is created for each blade inspection.
Click Create | Average Blade to open the Average Blade dialog box.

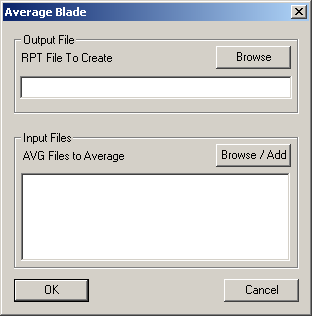
Average Blade dialog box
Click Browse and select an existing Report file, or create a new Report file, from the Save As dialog box. You can also type the full path and name in the RPT File To Create box.
Click Browse / Add to browse to and add existing Average files. The files to average appear in the AVG Files to Average box. You can also type the full path and name in the box.
To remove an entry, highlight it, right-click, and click Delete.
Click OK to create the specified Report file.
You can analyze this file similar to any PC-DMIS Blade Report file. For help, see "Creating Profile Plots".
Distribution File
The Distribution file indicates how points should be distributed on an airfoil section. For example, point number 1 is the nose point, and point number 120 is the tail point. The total length between them is equal to 100%.
If you want 60 points on this curve, then you should put a percentage distance from the nose point for each point.
More: