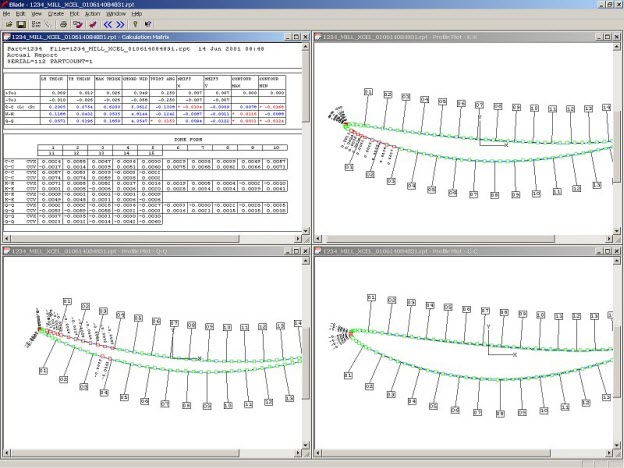
Airfoil section plots provide a graphical comparison of nominal versus actual contour. The contour plots also help in manufacturing processes like polishing.

Example of a Profile Plot in Exploded view
To create a Profile Plot, follow these steps:
Select File | Open, or click the Open button on the toolbar to display the Open dialog box.
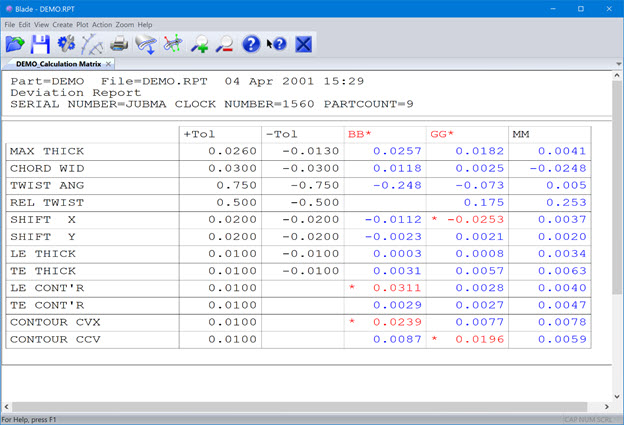
Select the report for the previously measured part, and click Open. PC-DMIS Blade analyses the report file:

Blade Analysis Report
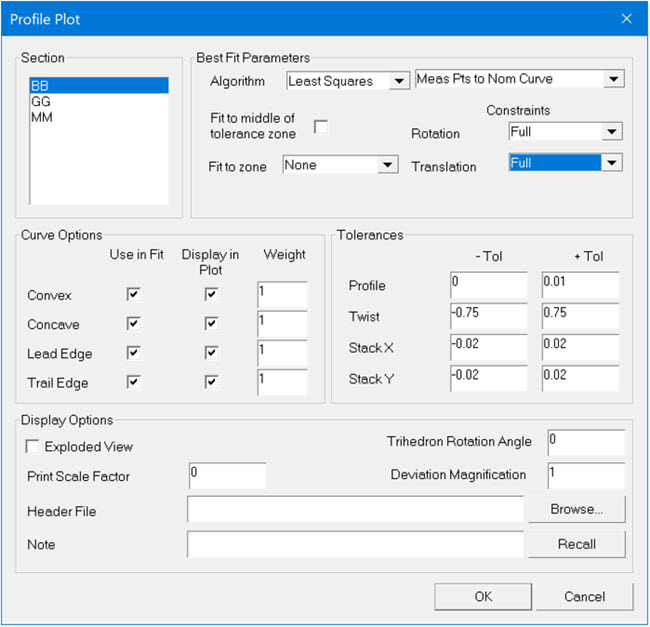
Select Plot | Create New Profile Plot, or click the Profile Plot button on the toolbar. The Profile Plot dialog box appears.

Profile Plot dialog box
Specify the parameters as described in "Profile Plot Options".
Click OK. PC-DMIS Blade creates the plot based on the Profile Plot options.
More:
Displaying Additional Plot Elements
Creating a Custom Template for Reports