The Playlist Summary View provides a summary of the entire playlist execution. It typically appears when a playlist finishes measurement. You can turn it on with the Summary switch at any time. This is available on the green bar of the bottom of the Measure screen that appears after each routine finishes execution.
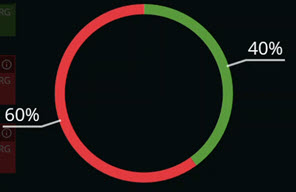
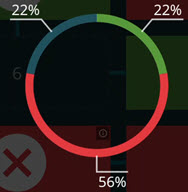
This playlist summary shows a colored circle graph with percentages for each of the Passed, Failed, and Aborted categories:
To the right of the colored circle graph, the summary view contains these pieces of information:
Total Parts Executed - The total number of routines that were executed.
Passed - The number of routines where all the measurements were within tolerance.
Failed - The number of routines where one or more measurements were out-of-tolerance.
Aborted - The number of routines that were skipped over or aborted and so weren't executed. An aborted routine occurs most often in pallet playlists when you skip over a cell.
Total Execution Time - The total amount of time that the software spent executing routines in the playlist.