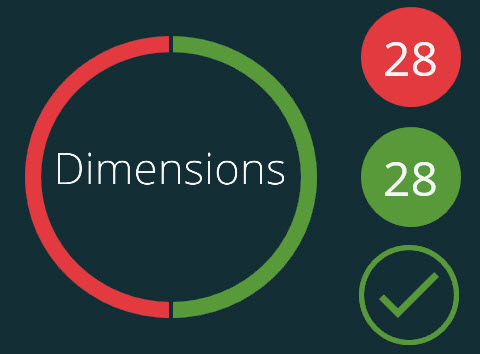
Sample colored circle graph
This topic is for a the results view for a single measurement routine execution, not for a playlist. If you want information about a summary of playlist results, see "The Playlist Summary View" topic.
Once Inspect finishes executing the measurement routine, the Measure screen changes to show the results of the execution. A colored circle graph and colored numbers to its right represent this information:
Failed - Red represents the number of out-of-tolerance dimension axes.
Passed - Green represents the number of in-tolerance dimension axes.
The colored circle under the numbers indicates if Inspect successfully generated a report:
![]() - This icon means Inspect generated a report.
- This icon means Inspect generated a report.
![]() - This icon means Inspect did not generate a report.
- This icon means Inspect did not generate a report.
With these buttons on the bottom bar, you decide what to do with the measurement results:
Re-measure - If enabled, you can click this button to re-measure the routine.
One or more of the buttons below may also appear if the measurement routine generated a report file. These buttons open up the full report:
 - This button opens the
.rtf report inside Word or some other .rtf viewer.
- This button opens the
.rtf report inside Word or some other .rtf viewer.
 - This button opens the
.pdf report in a PDF viewer.
- This button opens the
.pdf report in a PDF viewer.
 - This button opens up the
text report (.txt or .csv) in a text editor.
- This button opens up the
text report (.txt or .csv) in a text editor.
These buttons are common to PC-DMIS reports, but you may see other report buttons based on your add-ons and related software configurations.
Done - This button closes the bottom bar and the Measure screen.