
In this Topic Hide
Tolerance Zones and Allowed Modifiers
Actual Value and Measured Value
Lower Segments of Composite Profile of a Line
A profile of a line specification controls how much the cross sections of features' surfaces can deviate from being the nominal shapes. These cross sections are located and oriented to zero or more datums.
For this geometric tolerance, these three aspects work together:
Each considered feature's surface data
Each considered feature's nominal shape and each resulting tolerance zone
The datum features (if any are referenced)
To evaluate this tolerance, PC-DMIS optimizes each feature's surface data into its respective tolerance zone. The optimization process respects whatever constraints each datum imposes. With multiple considered features, the optimization process simultaneously considers those features. In this way it fits all the toleranced features into their tolerance zones at once.
You can use these feature types to represent surface cross sections if they have surface data:
lines, circles, 2D and 1D widths, scans, ellipses, notches, slots, and sets.
The tolerance zone is based on the nominal surface of the feature. By default (without any modifiers), the tolerance zone is equal bilateral. This means that half of the tolerance value is on each side of the nominal surface:
Suppose you have this profile of a line specification:

With the above specification, the actual value looks like this:
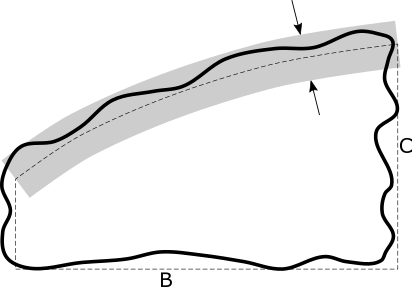
Since there are no modifiers, the tolerance zone is centered on the nominal surface, which is nominally oriented and located to each actual datum. The solid line indicates the actual surface, the dashed lines represent the nominal surfaces (including the actual datums) and the gray shaded area represents the minimum-size tolerance zone centered on the nominal surface containing the actual surface.
The measured value (with DEFAULT datum math) look like this:
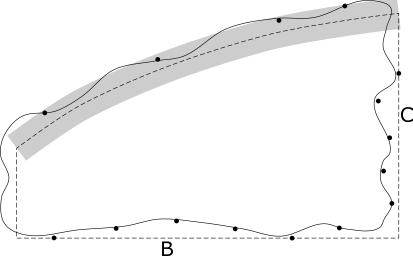
The measured tolerance zone center remains the nominal surface, which is nominally oriented and located to each measured datum. In this case, the measured points were not measured densely enough, and so the measured value is smaller than the actual value.
Modifiers may change the nature of the tolerance zone.
Under ASME Y14.5, PC-DMIS supports the  modifier (unequally
disposed profile) and the
modifier (unequally
disposed profile) and the  modifier (dynamic profile). Under ISO 1101, PC-DMIS supports the UZ modifier
(specified tolerance zone offset) and the OZ modifier (unspecified linear
tolerance zone offset). While they are not equivalent, the and UZ modifiers have similar
functionality. They offset the center of the tolerance zone from the nominal
surface. Likewise, the
and OZ modifiers have similar functionality. They allow the center of
the tolerance zone to progress in the plus-material or minus-material
direction.
modifier (dynamic profile). Under ISO 1101, PC-DMIS supports the UZ modifier
(specified tolerance zone offset) and the OZ modifier (unspecified linear
tolerance zone offset). While they are not equivalent, the and UZ modifiers have similar
functionality. They offset the center of the tolerance zone from the nominal
surface. Likewise, the
and OZ modifiers have similar functionality. They allow the center of
the tolerance zone to progress in the plus-material or minus-material
direction.
Here is an example of a modifier
specification. The equivalent ISO specification would be 0.08 UZ+0.04.

With the above specification, the specified tolerance zone looks like this:
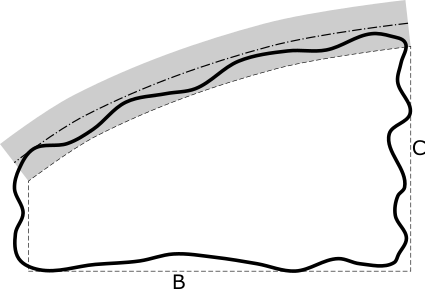
Because this is the specified tolerance zone, the tolerance zone is not minimized, and so it does not represent the actual value. The center of the tolerance zone is offset from the nominal surface and is shown in the dashed-dotted line.
The actual value looks like this:
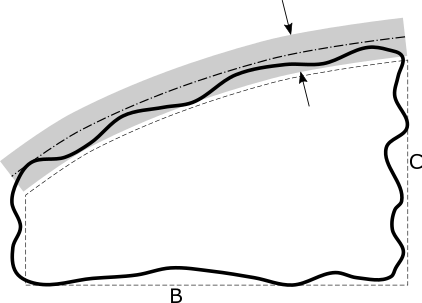
The center of the tolerance zone stays the same, but the zone is minimized until it just contains the actual surface.
Profile tolerance zones have a defined center. They also have a mechanism to grow and shrink the zone around that center until it just envelops the actual surface.
Actual Value:
Each considered feature has its own actual value. This is the size of the
smallest tolerance zone that contains the actual surface. The zone is
nominally oriented and located to each actual datum, with some exceptions
detailed in "How
PC-DMIS Solves Datums".
If you have more than one considered feature, and the datum reference frame is not fully constrained, the optimization procedure must simultaneously fit all the features' surfaces in their respective tolerance zones, if possible.
Measured Value:
Each considered feature has its own measured value. This is the size
of the smallest tolerance zone that contains the measured surface points.
The zone is nominally oriented and located to each measured datum, with
some exceptions detailed in "How
PC-DMIS Solves Datums".
If you have more than one considered feature, and the datum reference frame is not fully constrained, the PC-DMIS optimization procedure simultaneously fits all features' surface points into their respective tolerance zones. It does this in a proportional way. This guarantees that all toleranced features will fit in their respective tolerance zones if at all possible.
All input features (considered and datum) must have the correct specified nominal values and shapes. This ensures that PC-DMIS calculates the measured values correctly, and it ensures that the tolerance command correctly identifies the optimizable degrees of freedom.
Several types of features expose an ITERATEANDREPIERCE option. These features are points, scans, ellipses, notches, slots, and sets (except for 2D profile vision auto-features and edge point features) when a CAD model is available. When available, PC-DMIS sets the ITERATEANDREPIECE option to YES by default. It does this to ensure that the center of the tolerance zone is the CAD model surface. When the option is unavailable, or when NO is selected, those feature types create a separate planar tolerance zone for each measured point. The zone is defined by the theoretical point and vector associated with that measured point. This is called the "piecewise planar" approximation, which is excellent in many circumstances. It is poor in these cases:
If the alignment used to find nominals is significantly different than the optimized datum reference frame
If the measured data include sharp corners or radii
Due to the sometimes poor behavior of the piecewise-planar approximation, in most cases we recommend that you use a CAD model and keep the ITERATEANDREPIERCE option set to YES. In some circumstances, it makes sense to set this to NO if the computation time is too long. When you set it to NO, it usually improves computation speed, but you are responsible to ensure the piecewise planar approximation is a good approximation.
Lines, circles, and widths do not expose the ITERATEANDREPIERCE option because the geometric tolerance command internally represents the tolerance zones exactly. It is not possible to use the piecewise-planar approximation for those feature types. By contrast, 2D profile vision auto-features, edge point features, and scans made out of edge point features, and "adjust filter" constructed set features do not expose the ITERATEANDREPIERCE options because they always use the piecewise-planar approximation.
When no datums are referenced, the workplane option serves as a datum that defines the plane of the cross section, and defines the optimizable degrees of freedom. It can be set to ZPLUS, ZMINUS, XPLUS, XMINUS, YPLUS, or YMINUS.
When at least one datum feature has surface data, the datum math type controls how to compute the measured datums from the datum features' surface data.
For information, see "How PC-DMIS Solves and Uses Datums".
When there are no datum features, the tolerance zone math type controls how the measured surface points are optimized into their respective tolerance zones:
DEFAULT - This does a minimum-zone best fit (also called min-max). This best-fit finds the smallest tolerance zone that contains the surface points. Thus, the DEFAULT option produces the smallest measured value for evaluating profile of a line. It is also mathematically very similar to the specification, because if you measure points densely and with high accuracy, the measured value closely approximates the actual value.
LSQ - This does a least-squares best fit. It minimizes the sum of the squares of the deviations to the center of the zone. This option produces a larger measured value (it is more conservative than the DEFAULT option). But in general, this option computes more quickly.
A profile of a line tolerance with multiple segments is called a “composite profile of a line”. The first (or upper) segment of a composite profile of a line tolerance is the same as a single segment profile of a line as described above at the beginning of this topic. All lower segments of a composite profile of a line are subtly different. This is because the tolerance zones have unlocked translation compared to the datum reference frame. However, the tolerance zones remain nominally located and oriented to each other.
The datum reference frames for the lower segments of a composite profile of a line follow these rules:
Each datum reference frame must only use the same datums as the reference frame above it.
The datums must be in the same order.
The datums must have the same modifiers.
A lower segment can have fewer datums than the segment above.
Suppose the upper segment has datums ABC. The lower segment then could reference no datums, datum A, datums AB, or datums ABC. But it could not reference datums BA nor AC nor ABD.
Here are some examples of allowed composite position tolerances:


Here are some examples of not-allowed composite position tolerances:


Here is an example report for a profile of a line tolerance of a circle.

When the profile of a line tolerance has no datums, a per unit check box becomes visible. If you select this check box, profile of a line has two segments. The first (upper) segment is the overall profile of a line as described above. The lower segment is the per-unit profile of a line, which defines a unit length. The per-unit tolerances control the form of every possible unit of the toleranced feature.
Conceptually, the entire surface cross section is divided into an infinite number of overlapping unit lengths.
Actual Value:
Each of the infinite units has its own actual value. For the entire feature,
this is the actual value of the worst unit.
Measured Values:
A very large number of overlapping units contain subsets of the measured
points. For any given unit, the measured value is the maximum deviation
minus the minimum deviation, where the deviations were calculated with
the overall profile of a line. The measured value of the entire feature
is the measured value of the worst unit.
Here is an example report for a profile of a line per unit tolerance. The upper label is for the overall profile of a line, and the lower label is for the per unit profile of a line.
