
PC-DMIS provides you with graphical overlays that it draws on top or around features that you create or edit in the Graphic Display window. These colored overlays give a visual perspective for matching colored parameters or settings in the Probe Toolbox and in the Auto Feature dialog box.
You can turn these visualization overlays on or off with the Visualization Tools ON/OFF icon from the Laser Scan Properties tab of the Probe Toolbox (View | Other Windows | Probe Toolbox).

Visualization Tools ON/OFF icon
Below are some examples. These examples cover all of the possible graphical overlays.
Explanation of Colored Overlays
Yellow Line or Circle - The Overscan region.
Blue Line or Circle - The feature's Depth value.
Red Line - The feature's Indent value.
Purple Circle - The feature's Spacer value.
Pink Circles or Pink Rectangles - The feature's Ring Band value.
Cones and Cylinders Overlays
DCC Cylinders and Cones show their bounds (the start and end points plus the Overscan value) in a light sea-green color. See the image of the DCC cone example below.
Portable Cylinders and Cones (or Feature Extraction only features) show their bounds (the start and end points minus the Vertical Clipping value) in a lime-green color. See the image of the Portable cylinder example below.
For information on specific parameters or features, see the appropriate topics in the "Creating Auto Features with a Laser Sensor" section of the PC-DMIS Laser documentation.
Some Sample Features with Overlays
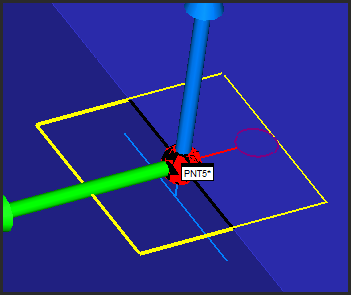
Sample Edge Point Auto feature
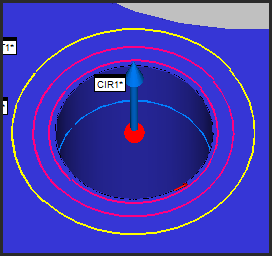
Sample Circle Auto feature
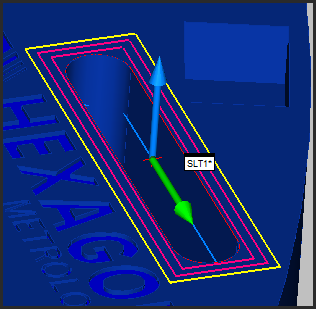
Sample Slot Auto feature
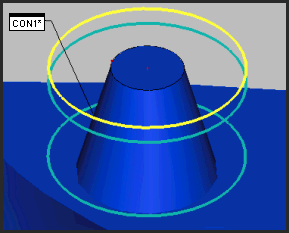
Sample DCC Cone Auto feature
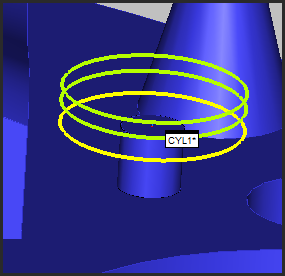
Sample Portable Cylinder Auto feature