If the Chromatic White Light Sensor (CWS) is the active probe in the measurement routine, PC-DMIS Vision adds a Laser tab with a spectrum plot. When the software is not executing the measurement routine, the spectrum plot shows the structure ("noise") of the CWS signal. This helps you select the optimal settings for parameters, such as illumination and frequency.
Note the following:
PC-DMIS does not update the spectrum plot during measurement routine execution.
When the Laser tab is selected and updating, the CWS Intensity and Distance readouts do not appear in the Probe Readouts window.
The minimum requirements to use the spectrum plot are:
A CHRocodile S, CHRocodile SE, or a CHRocodile 2SHS white light sensor
CHRocodile firmware version starting with 5.97
A CHRocodile sensor that is connected to the personal computer with a USB cable or Ethernet
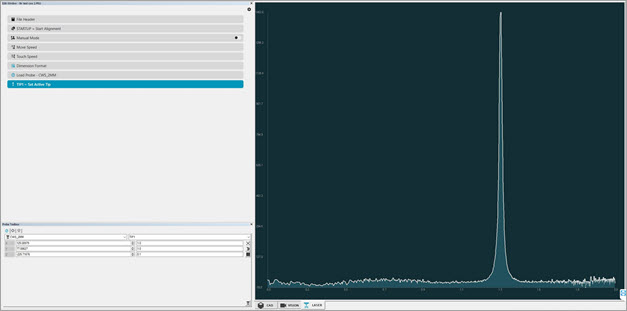
X axis - The X-axis of the spectral diagram represents the total range of the calibrated distance of the sensor. As the Z axis moves in the positive direction, the plot's peak moves from left to right.
Y axis - The spectrum plot's Y axis shows the signal strength. For best results for distance measurement, there should be a single and sharp dominant peak similar to the one shown in this example:
Example of spectrum plot in Laser tab