The Flush and Gap analysis is comprised of these three regions. Consult the diagram at the bottom of this topic:
Gap region - In the Gap region, the points that are analyzed are in a box centered on the gap point and oriented along the Gap vector. The box's height is 60% of Gap length value. The width is 130% of Gap length value.
Master Flush region - In the Master Flush region, the points are analyzed in an area that begins at the Master Side point in a direction opposite from the Master Edge Vector. It has a length that is 60% of the Gap length value.
Gauge Flush region - In the Gauge Flush region, the points are analyzed in an area that begins at the Gauge Side point in the direction opposite from the Gauge Edge Vector. It has a length that is 60% of the Gap length value.
The Flush and Gap analysis is performed using these measured items.
Gap Point and Vector
Master Side Point
Master Side Surface and Edge Vectors
Gauge Side Point
Gauge Side Surface and Edge Vectors
PC-DMIS computes the Flush and Gap measured point's distance from these four measured reference planes:
The first two planes are the Gap analysis reference planes defined from the two measured Minimum Distance Points (where the Gap distance is calculated) and the measured Gap Vector.
The third plane is the measured Master Side analysis reference plane. It is defined by the measured Master Side Point and the measured Master Side Surface Vector.
The fourth plane is the measured Gauge Side analysis reference plane. It is defined by the measured Gauge Side Point and the measured Gauge Side Surface Vector.
To reduce the analysis time, PC-DMIS only uses the points closest to the cut plane (less than 0.5 mm or 0.19685 inches).
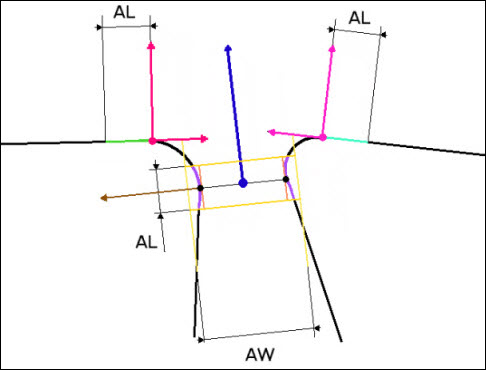
Graphical Analysis Diagram:
Key:
AL - Analysis Length. It is 60% of the Gap length value.
AW - Analysis Width. It is 130% of the Gap length value.
 - Minimum Distance Points
 - Gap Vector
 - Gap Point and View Vector
 - Gauge Side Point and Vectors
 - Master Side Point and Vectors
 - Master Side Flush analysis region.
Reference Plane.
- Master Side Flush analysis region.
Reference Plane.
 - Gauge Side Flush analysis region.
Reference Plane.
- Gauge Side Flush analysis region.
Reference Plane.
 - Gap analysis region
 - Gap analysis reference plane