
The Grid Chart gage can be used to determine the Center Location (X and Y) of the grid pattern as well as the Spacing between grid lines as read form the Gage tab of the Probe Toolbox or the corner of the Vision tab.
|
The Grid Chart gage can be used to determine the Center Location (X and Y) of the grid pattern as well as the Spacing between grid lines as read form the Gage tab of the Probe Toolbox or the corner of the Vision tab. |
For information on controlling the Circle gage, see the "Rotating,
Sizing, or Moving Gages" topic.
Grid Chart Example
To check features in relation to grid lines:
From the Probe Toolbox, adjust the magnification and lighting as needed. See "Probe Toolbox: Magnification tab" and "Probe Toolbox: Illumination tab".
Move the machine so that the features requiring comparison are within the Field of View (FOV).

Change the gage type to Grid Chart Gage.
From the Gage tab, double-click the Grid box, and type the nominal value of 0.500.
Drag any one grid intersect to the bottom of the "V".
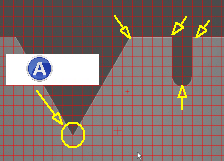
(A) - Drag 1 grid point to the "V"
All other geometry can be visually compared to the grid lines.