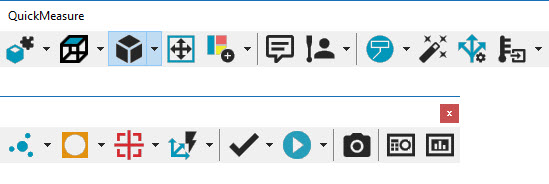
The Portable QuickMeasure toolbar models the typical flow of operation for Portable users.
To access it, select View | Toolbars | QuickMeasure.
The toolbar provides drop-down functionality for many of the buttons.
PC-DMIS stores the last-selected option for each button and displays it the next time the software shows the toolbar.
You can add the drop-down buttons to any customizable toolbar from the View | Toolbars | Customize menu option.
For details, see "Customizing Toolbars" in the "Navigating the User Interface" chapter in the PC-DMIS Core documentation.
The QuickMeasure toolbar provides these options:
![]() CAD -
Provides options to set up the CAD model.
CAD -
Provides options to set up the CAD model.
Click the small black arrow to display the CAD toolbar:
For details, see "CAD Setup Toolbar" in the "Using Toolbars" chapter in the PC-DMIS Core documentation.
![]() Graphic View
- Resets the Graphic Display window to the graphical view shown
on the button.
Graphic View
- Resets the Graphic Display window to the graphical view shown
on the button.
Click the small black arrow to display the Graphic View toolbar:

For details, see "Graphic View Toolbar" in the "Using Toolbars" chapter in the PC-DMIS Core documentation.
![]() Graphic Items
- Changes the Graphic Display window to display or hide the graphical
item properties shown on the button.
Graphic Items
- Changes the Graphic Display window to display or hide the graphical
item properties shown on the button.
Click the small black arrow to display the Graphic Items toolbar:

For details, see "Graphic Items Toolbar" in the "Using Toolbars" chapter in the PC-DMIS Core documentation.
![]() Scale to Fit
(Ctrl + Z) - Re-draws the part image to fit entirely within the
Graphic Display window. This function is useful whenever the image becomes
too large or small. You can also press Ctrl + Z on your keyboard to re-draw
the image.
Scale to Fit
(Ctrl + Z) - Re-draws the part image to fit entirely within the
Graphic Display window. This function is useful whenever the image becomes
too large or small. You can also press Ctrl + Z on your keyboard to re-draw
the image.
![]() Graphic Viewset
- Depending on the button icon that is displayed, when clicked,
the current Viewset can be saved, or an existing Viewset can be recalled.
Graphic Viewset
- Depending on the button icon that is displayed, when clicked,
the current Viewset can be saved, or an existing Viewset can be recalled.
Click the small black arrow to display the Graphic Viewset toolbar:

For details, see "Graphic Modes Toolbar" in the "Using Toolbars" chapter in the PC-DMIS Core documentation.
![]() Comment
- Opens the Comment dialog box so that you can
insert different comment types into the measurement routine. By default,
the software selects the Operator option.
Comment
- Opens the Comment dialog box so that you can
insert different comment types into the measurement routine. By default,
the software selects the Operator option.
For details, see "Inserting Programmer Comments" in the "Inserting Report Commands" chapter in the PC-DMIS Core documentation.
![]() Probe Mode
- Sets and adds the Probe Mode feature that
is displayed on the button to the measurement routine.
Probe Mode
- Sets and adds the Probe Mode feature that
is displayed on the button to the measurement routine.
Click the small black arrow to display the Probe Mode toolbar where you can select between Manual Mode and DCC Mode.
For details, see "Probe Mode Toolbar" in the "Using Toolbars" chapter in the PC-DMIS Core documentation.
![]() Graphic Mode
- Sets the screen mode that is related to the icon shown on the button,
either Program Mode or Translate
Mode.
Graphic Mode
- Sets the screen mode that is related to the icon shown on the button,
either Program Mode or Translate
Mode.
Click the small black arrow to display the Graphic Mode toolbar:
For details, see "Changing Screen Modes" in the "Editing the CAD Display" chapter in the PC-DMIS Core documentation.
![]() Quick Start
- Toggles the Quick Start functionality on and off.
Quick Start
- Toggles the Quick Start functionality on and off.
For details, see "Quick Start Interface" in the "Using Other Windows, Editors, and Tools" chapter in the PC-DMIS Core documentation.
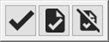
![]() Measurement Strategy Editor - Opens the Measurement Strategy Editor dialog box so that
you can modify the settings for all Auto features and store them as custom
groups.
Measurement Strategy Editor - Opens the Measurement Strategy Editor dialog box so that
you can modify the settings for all Auto features and store them as custom
groups.
For details, see "Using the Measurement Strategy Editor" in the "Setting Your Preferences" chapter in the PC-DMIS Core documentation.
![]() Gage -
Opens the Gage dialog box to add a Caliper,
Thickness, or Temperature command into the current measurement routine.
Gage -
Opens the Gage dialog box to add a Caliper,
Thickness, or Temperature command into the current measurement routine.
Click the small black arrow to display the Gage toolbar.
For details on the Caliper gage, see "Caliper Overview" in the PC-DMIS Laser documentation.
For details on the Thickness gage, see "Thickness Gage" in the PC-DMIS Core documentation.
For details on the Temperature gage, see "Temperature Gage" in the PC-DMIS Core documentation.
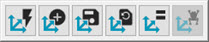
![]() Auto Feature
- Displays the Auto Feature dialog box that
is related to the icon shown on the button. From the dialog box, you can
select any of the available feature commands to insert into the measurement
routine.
Auto Feature
- Displays the Auto Feature dialog box that
is related to the icon shown on the button. From the dialog box, you can
select any of the available feature commands to insert into the measurement
routine.
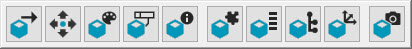
Click the small black arrow to display the Auto Feature toolbar:

For details, see "Inserting Auto Features" in the "Creating Auto Features" chapter in the PC-DMIS Core documentation.
![]() Constructed
Feature - Displays the Constructed Feature
dialog box that is related to the icon shown on the button. From the dialog
box, you can select any of the available feature commands to insert into
the measurement routine.
Constructed
Feature - Displays the Constructed Feature
dialog box that is related to the icon shown on the button. From the dialog
box, you can select any of the available feature commands to insert into
the measurement routine.
Click the small black arrow to display the Constructed Feature toolbar:

For details, see the "Constructing New Features from Existing Features" chapter in the PC-DMIS Core documentation.
![]() Dimension
- Displays the Dimension dialog box that is
related to the icon shown on the button. From the dialog box, you can
select any of the available dimension commands to insert into the measurement
routine.
Dimension
- Displays the Dimension dialog box that is
related to the icon shown on the button. From the dialog box, you can
select any of the available dimension commands to insert into the measurement
routine.
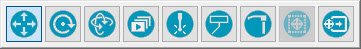
Click the small black arrow to display the Dimension toolbar:

For details, see "Dimensioning Location" in the "Using Legacy Dimensions" chapter in the PC-DMIS Core documentation.
![]() Alignment
- Displays the Alignment options based on:
Alignment
- Displays the Alignment options based on:
What types of features you selected
The order that you selected the features
The positions of the features relative to each other
Click the small black arrow to display the Alignment toolbar:
For details, see the "Creating and Using Alignments" chapter in the PC-DMIS Core documentation.
![]() Mark -
Provides options to mark the currently selected feature, mark all features,
or clears all marked features in the Edit window. This depends on the
selection you made on the drop-down toolbar.
Mark -
Provides options to mark the currently selected feature, mark all features,
or clears all marked features in the Edit window. This depends on the
selection you made on the drop-down toolbar.
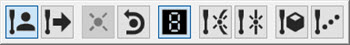
Click the small black arrow to display the Mark toolbar:
For details, see the "Edit Window Toolbar" chapter in the PC-DMIS Core documentation.
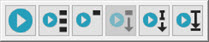
![]() Execute
- Runs (or executes) the measurement process for any currently marked
feature(s).
Execute
- Runs (or executes) the measurement process for any currently marked
feature(s).
Click the small black arrow to display the Execute toolbar:
For details on how to execute your measurement routine, see "Executing Measurement Routines" in the "Using Advanced File Options" chapter in the PC-DMIS Core documentation.
![]() Snapshot
- Inserts a SNAPSHOT command of the
current Graphic Display window state into the Edit window. When you execute
this command, PC-DMIS inserts an image capture at that state into your
report.
Snapshot
- Inserts a SNAPSHOT command of the
current Graphic Display window state into the Edit window. When you execute
this command, PC-DMIS inserts an image capture at that state into your
report.
For details, see "Inserting Snapshots" in the "Inserting Report Commands" chapter in the PC-DMIS Core documentation.
![]() Status Window
- Displays the Status window. You can use this window to preview commands
and features while you create them from the Quick Start toolbar, during feature execution,
dimension creation or editing. You can also click on the item in the Edit
window with the Status window open.
Status Window
- Displays the Status window. You can use this window to preview commands
and features while you create them from the Quick Start toolbar, during feature execution,
dimension creation or editing. You can also click on the item in the Edit
window with the Status window open.
For details, see "Using the Status Window" in the "Using Other Windows, Editors, and Tools" chapter in the PC-DMIS Core documentation.
![]() Report Window
- Displays the Report window. After execution of the measurement routine,
this window displays your measurement results and automatically configures
the output according to a default report template.
Report Window
- Displays the Report window. After execution of the measurement routine,
this window displays your measurement results and automatically configures
the output according to a default report template.
For details, see "About the Report Window" in the "Reporting Measurement Results" chapter in the PC-DMIS Core documentation.