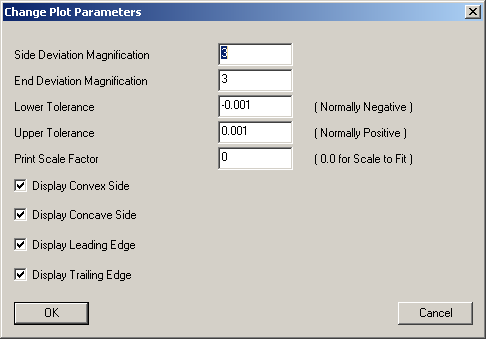
To change plot parameters, select Plot | Change Plot Parameters, or click the Plot Parameters button on the toolbar to open the Change Plot Parameters dialog box.

Change Plot Parameters dialog box
Modify the following values to affect the display of the Profile Plot:
Side Deviation Magnification and End Deviation Magnification - Increasing the deviation magnification increases the contrast between the nominal and actual value. This further accentuates the measured deviations to help determine problem areas.
Lower Tolerance and Upper Tolerance - Specify the upper and lower tolerances, beyond which actual points would be considered to be out of tolerance.
Print Scale Factor - Determines the scale factor for the display of the Profile Plot. If you increase this value, the print zooms in on the center of the plot. You may want to move the plot (hold right-click and drag) to focus on a specific region of the plot.
Display Convex Side, Display Concave Side, Display Leading Edge, and Display Trailing Edge - These check boxes toggle the display of the respective element in the profile plot.
Resetting the View or Restoring Zoom
To perform scale to fit for the current zoom setting, select Plot | Restore Zoom.
To perform scale to fit for the current zoom setting, select Plot | Reset View. This menu option also clears any annotations.
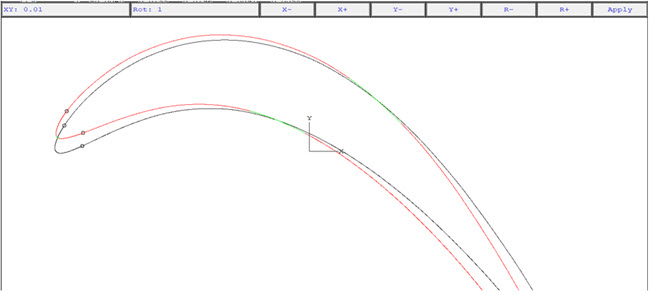
You can shift or rotate the airfoil section plot to get a manual bestfit plot. To set the shift and rotation increment, click the value and then click the Apply button. Each click of the X-, X+, Y-, Y+, R-, R+ re-plots the airfoil section. This is very similar to what you do on an optical comparator with a nominal overlay of a profile.

More:
Displaying Additional Plot Elements
Creating a Custom Template for Reports