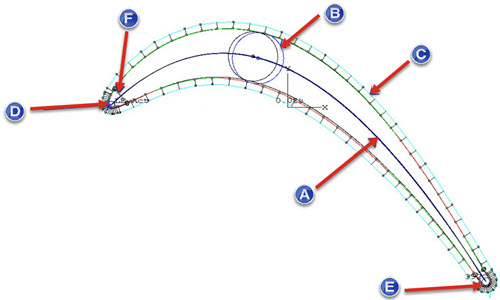
After you create the plot, you can use the Plot menu to add graphical elements to the display of your profile plot.

Profile Plot with additional graphical elements added
This describes the various elements that you can add.
Select Plot | Show Mean Camber to display the nominal (black) and actual (blue) mean camber lines (MCL).
Select Plot | Max Thickness to display the circles for which the diameter values represent the nominal (black) and actual (blue) maximum thickness of the blade. The X, Y, and Radius nominal, actual, or deviation values are also denoted depending on the option that you select on the Plot | Report menu.
Select Plot | Show Compensation to do the following:
Show the original ball centers that the CMM measured.
Show the associated compensated points.
Draw lines from the original ball centers to the compensated curve.
Select Plot | Show Leading Edge to display the circles for which the diameter values represent the nominal (black) and actual (blue) leading edge location and radius. The X, Y, and Radius nominal, actual, or deviation values are also denoted depending on the option that you select on the Plot | Report menu.
Select Plot | Show Trailing Edge to display circles for which the diameter values represent the nominal (black) and actual (blue) trailing edge location and radius. The X, Y, and Radius nominal, actual or deviation values are also denoted depending on the option that you select on the Plot | Report menu.
Select Plot | Show Edge Thickness to display the leading edge and trailing edge plot thicknesses. The nominal (black) and actual (blue) thicknesses are shown on the plot. Most blades only have one thickness check per end but PC-DMIS Blade provides allows you up to 10 thickness checks. In the Thickness Index dialog box, type the thickness calculation. For example, 1 for edge thickness 1, 2 for edge thickness 2, and so forth.
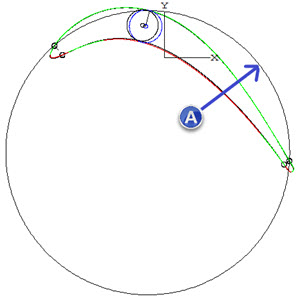
Select Plot | Show Cupping to display any cupping calculation results. This way, when you have a form plot, you can see the three line segments that connect the MCL to the blade surface. You can also see the cupping circle. In the Cupping Index dialog box, you need to enter an index from 1 to 10 so it knows which cupping calculation to draw. If you are using the FULL_CC or FULL_CV calculation method, the line segment looks the same (MCL to surface), but the MCL endpoint is the center of the max-thickness circle, and the surface point is where the max-thickness circle touches the surface.

A- Cupping Radius
Annotation in Plot
To add annotations for points along the spline of the profile plot or calculated widths at selected locations, double-click on the profile plot.
The plot menu offers two options to configure and add annotation to plot.
Double Click To
Report
The type of feature for which annotations are added depends on the Plot | Double Click To menu option that you select.
Select Inspected Point - A new annotation is added for the closest actual measured point from the double-click location along the blade spline.
Select Any Point - A new annotation is added for the closest point (nominal or actual) from the double-click location along the blade spline.
Calc Width - A new annotation and a width diameter circle are added based on the double-click location and the closest measured points on the opposing sides of the blade.
To change the type of annotation value for Point, Width Calculations, Leading Edge Points, and Trailing Edge Points, select from the following options on the Plot | Report menu:
More:
Creating a Custom Template for Reports