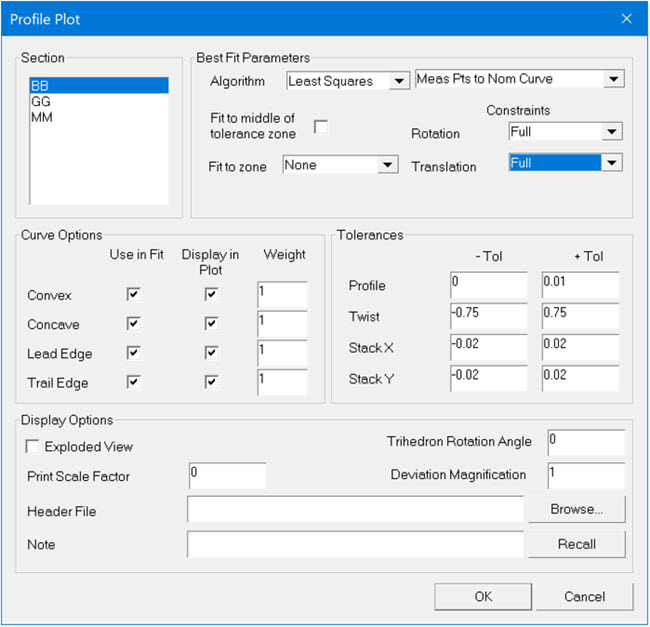
You can use the Profile Plot dialog box to define the parameters that are used to create a Profile Plot.

Profile Plot dialog box
Section Area
Select the section that you want to display.
Best Fit Parameters Area
Algorithm list - Select the bestfit math to use to create the plot:
None - No fit is applied.
Least Square Bestfit
Meas Pts to Nom Curve parameter - Points are measured to the nominal curve.
Meas Curve to Nom Pts parameter - The curve is measured to the nominal points.
Fit to middle of tolerance zone check box - If you select this check box, it fits to the middle of the zone based on the zone defined in the nominal file.
Constraints lists
The options in the Rotation list are:
Full - The rotation is optimized on every section.
None - The rotation is not optimized.
In Tol - The rotation is optimized, but the rotation is constrained to lie within the tolerance zone defined by the minus and plus tolerance values for the Twist option in the Tolerances area.
The options in the Translation list are:
Full - The translation is optimized on every section.
None - The translation is not optimized.
In Tol - The translation is optimized, but the translation is constrained to lie within a rectangular tolerance zone that is defined by the minus and plus tolerance values for Stack X and Stack Y in the Tolerances area.
To Pivot - Does not do a least squares fit at all, but rather does a two-point fit. If the pivot is LE Center, then the center of the smallest radius of the leading edge is the "pivot point" that is matched between the measured and nominal curves.
Afterwards, a point 75% along the length away from the pivot is chosen, and the rotation around the pivot makes the line segments from the pivot point to the 75% point collinear. This process is very similar to the 2 Point MCL best fit, but the pivot point is not a 5% point; instead, it is the chosen pivot. The chosen pivot may be either a nose/tail point itself, or the center of the smallest radius of the leading/trailing edge.
Fit to zone - This list lets you select a tolerance zone to fit. This option helps to control how the section fits to a tolerance zone (if any).
2 Point from Nose and 2 Points from Tail
LE Percent box - This value provides the location of leading edge "balance" points as a percentage of the length of the MCL. For example, a value of 10 defines a point 10% along the MCL.
TE Percent box - This value provides the location of trailing edge "balance" points as a percentage of the length of the MCL. For example, a value of 90 defines a point 90% along the MCL.
Min Max
Fit to middle of tolerance zone check box - If you select this check box, it fits to the middle of the zone based on the zone defined in the nominal file.
Fit to zone - This option helps to control how the section fits to a tolerance zone (if any).
Curve Options Area
Use in Fit column - Select the Convex, Concave, Lead Edge, and Trail Edge check boxes for the sides or edges that are used in the fit.
Display in Plot column - Select the Convex, Concave, Lead Edge, and Trail Edge check boxes for the sides or edges that are used in the plot.
Weights column - Provides the weight that is given to the associated edge or side in determining the best fit.
Tolerances Area
These values define the plus and minus tolerances for these options:
Profile - The values for the positive deviation and negative deviation define a tolerance zone. If you select the Fit to middle of tolerance zone check box, it fits to the middle of that zone (if it is defined) instead of fitting to the zone defined in the nominal file. Specifically, if the plus deviation is larger than the minus deviation (the zone has a non-zero size). If the Fit to middle of tolerance zone check box is selected, then it uses that zone instead of the zone defined in the Nominal file.
Twist
Stack X and Stack Y - See also Displacement.
Display Options Area
Exploded View check box - This view separates the leading and trailing edges from the sides for a better picture of the separate areas of the blade. For an example of exploded views, see "Reporting Options".
Trihedron Rotation Angle box - Rotates the trihedron for viewing purposes.
Print Scale Factor box - Changes the scale of the print.
Deviation Magnification box - Applies to when you magnify the deviations on a profile plot. You plot the following:
(nominal curve) + (magnification)*(measured curve - nominal curve)
Header File box - Enables you to put text above the profile plot. The contents of the Header file can be up to nine lines long. Each line of the Header file is put into a 3x3 matrix of displayed text in the header of the profile plot. For more information, see "Header File" and "Editing the Header File."
Browse button - Enables you to select the existing header file.
Note box - Is put into the profile plot.
Recall button - If you edit the note but then decide to change it, press Recall to recover the note as it appeared the last time you pressed OK in this dialog box.
More:
Displaying Additional Plot Elements
Creating a Custom Template for Reports