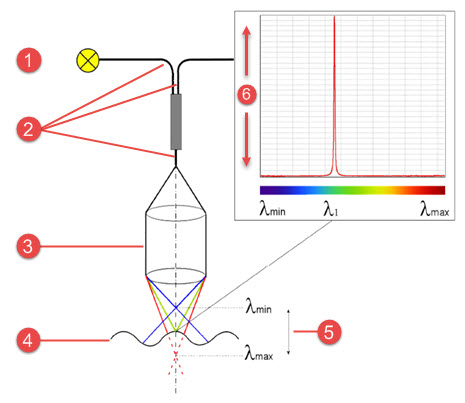
An example of a typical CWS system is shown below:
1 - Light Source
2 - Fiber Optic Cables
3 - Measuring Head
4 - Surface of feature being scanned
5 - Measuring Range
6 - Intensity
CWS Spectrum
The spectrum chart from the CWS sensor is in many ways very similar to the focus graph from the camera.
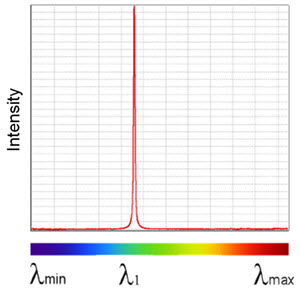
Example of the CWS spectrum chart
Similar to the focus graph, the spectrum allows you to quickly see the quality of the measurement. It also helps you choose the correct settings for the material being sampled.
More: