The Playlist Execution View of the Measure screen shows the execution progress for both regular playlists and for pallet playlists.
Inspect executes the measurement routines based on the order defined in the playlist settings.
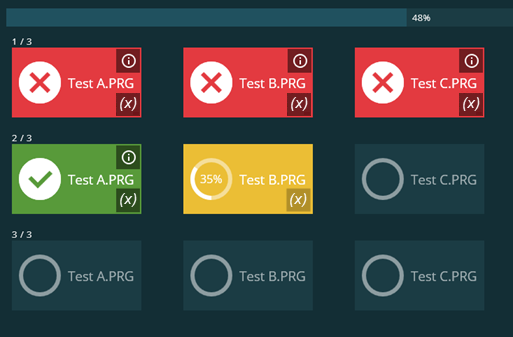
If you use the Repetition setting to repeat the playlist, those repetitions appear as numbered rows. For example, "1 / 3" means the first of three executions.

Playlist Execution Example of three Routines (A, B, and C) Repeated Three Times
Orange - Indicates that measurement is underway for that routine. A circular progress indicator shows its progress.
Red - Indicates that one or more measurement results are out of tolerance in that routine.
Green - Indicates that all the measurement results in that routine are in tolerance.
Uncolored - Indicates unmeasured routines.
By default, execution pauses between routines, and you need to click Done to proceed to the next routine. A green bar appears at the bottom of the screen after each routine or after each cell finishes execution. It shows "Measurement Completed", and it contains these items:
Summary - This switch is turned off until the entire playlist finishes execution. You can turn on this switch to view the Playlist Summary View at any time.
Re-Measure - Measures the last routine or the last cell again.
Done - Closes the measurement results and proceeds to the next routine or cell. If this is the last measurement routine or cell, it closes the screen.
Cancel - This cancels the execution.
You can change this behavior if you enable the Auto Continue option in the Settings tab on the playlist dialog box. For information, see "The Playlist Dialog Box".
The Pallet Execution Options screen may appear as an overlay on top of the grid for you to choose what cells to execute and any initial variable values. For information, see "The Pallet Execution Options Screen".
Execution starts in the start position cell (cell one) and then moves through the grid, executing each cell in order. If you chose to skip any cells, the probe merely passes over them.
If you use a manual alignment, only the first cell runs the alignment. Other cells use the alignment from the first cell.
A pallet view of the Playlist Execution View
appears. This view lets you see the progress of the pallet execution.
If you leave this screen, and you need to get back to it, from the
thin sidebar, you can click the Show Playlist Execution
button ( ):
):

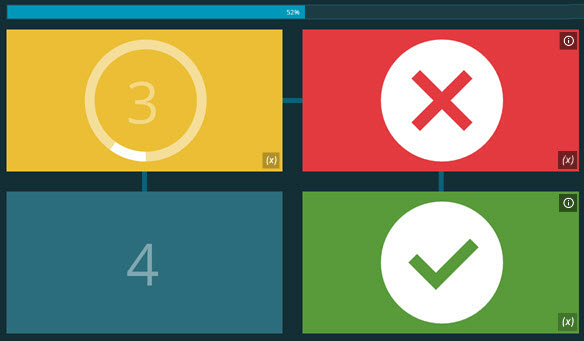
Pallet Playlist Execution Example of Four Cells
Note that the colors in the above example and in the key below are from the Dark theme:
Dark Teal - Indicates an unexecuted cell.
Charcoal Black - Indicates a skipped cell.
Orange - Indicates that measurement is underway in that cell. A circular progress indicator shows its progress.
Red - Indicates that one or more measurement results are out of tolerance in that cell.
Green - Indicates that all the measurements in that cell are in tolerance.
The blue bars that connect the cells indicate the execution direction.
By default, execution continues without interruption between pallet cells. You can change this behavior if you disable the Auto Continue option in the Settings tab on the playlist dialog box. For information, see "The Playlist Dialog Box".
Common Elements
These elements are common to both styles of playlists.
A progress bar at the top of the window provides the overall completion percentage.
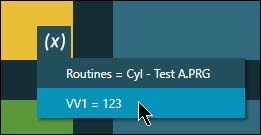
 - If your playlist uses
trace fields, this Trace fields button appears
in the bottom right of each grid in the pallet. This button displays
a small window just below the button with the trace field values:

Example of Trace field values
Once a routine or pallet cell finishes execution, an information icon appears in the top corner of each grid. You can use it to open a PDF report for the cell.
![]()
You can also later access the reports from the Reports screen.
At the end of execution, the Playlist Execution View remains open so that you can view the execution results. The green bar appears as described in "Regular Playlists" above. It shows "Execution Completed" and contains the Done and Re-Measure buttons.