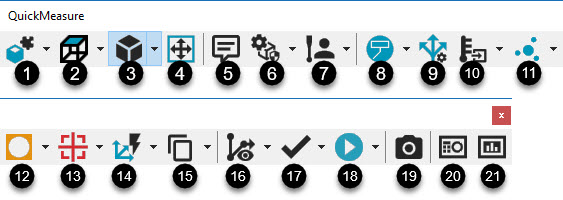
PC-DMIS CMM QuickMeasure toolbar
From left to right, the CMM QuickMeasure toolbar models the typical flow of operation on a CMM. To access it, select View | Toolbars | QuickMeasure.
The toolbar provides drop-down functionality for many of the buttons. PC-DMIS stores the last-selected option for each button and displays it the next time you display the QuickMeasure toolbar.
You can add the drop-down buttons to any customizable toolbar from the View | Toolbars | Customize menu option. For details, see the "Customizing Toolbars" chapter in the PC-DMIS Core documentation.
The following buttons are available on the CMM QuickMeasure toolbar:
When you run PC-DMIS in Operator mode, the following options appear on the CMM QuickMeasure toolbar: Graphic View, Graphic Items, Scale to Fit, Probe Mode, Execute (full execute only), Status Window, and Report Window.
1. CAD Setup button - This button provides options to set up the CAD model.
Click the small black arrow to display the CAD Setup toolbar:

For details, see "CAD Setup Toolbar" in the PC-DMIS Core documentation.
2. Graphic View button - This button resets the graphic in the Graphic Display window to the graphical view shown on the button.
Click the arrow to display the Graphic View toolbar:

For details, see "Graphic View Toolbar" in the PC-DMIS Core documentation.
3. Graphic Items button - This button resets the graphic in the Graphic Display window to display or hide the graphical item shown on the button.
Click the small black arrow to display the Graphic Items toolbar:

For details, see the "Graphic Items Toolbar" topic in the PC-DMIS Core documentation.
4. Scale to Fit - This button redraws the part image to fit entirely within the Graphic Display window. This function is useful whenever the image becomes too large or small. You can also press Ctrl + Z to redraw the image.
5. Comment button - This button opens the Comment dialog box so that you can insert different comment types into the measurement routine. By default, the software selects the Operator option. For details, see the "Inserting Programmer Comments" chapter in the PC-DMIS Core documentation.
6. ClearanceCube button - This button performs the ClearanceCube function shown on the button.
Click the small black arrow to display the ClearanceCube toolbar:
![]()
For details, see the "ClearanceCube Toolbar" topic in the PC-DMIS Core documentation.
7. Probe Mode button - This button sets the probe mode feature shown on the button and adds the feature to the measurement routine.
Click the small black arrow to display the Probe Mode toolbar:
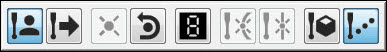
For details, see the "Probe Mode Toolbar" topic in the PC-DMIS Core documentation.
8. Graphic Modes button - This button sets the screen mode that is related to the icon shown on the button.
Click the small black arrow to display the Graphic Modes toolbar:
For details on the different graphic modes, see "Graphic Modes toolbar" in the PC-DMIS Core documentation.
9. Measurement Strategy Editor button - This button opens the Measurement Strategy Editor dialog box so that you can modify the settings for all Auto features and store them as custom groups. For details, see "Using the Measurement Strategy Editor" topic in the PC-DMIS Core documentation.
10. Gage button - This button opens the Gage dialog box for the Gage command shown on the button. From the dialog box, you can select a Gage command to insert into the measurement routine.
Click the small black arrow to display the Gage toolbar. The available gages are:
Caliper gage - For details on the Caliper gage, see the topic "Caliper Overview" in the PC-DMIS Laser documentation.
Temperature Compensation gage - For details on the Temperature Compensation gage, see the topic "Using Simplified Temperature Compensation" in the PC-DMIS Core documentation.
Thickness gage - For details on the Thickness gage, see the topic "Thickness Gage" in the PC-DMIS Core documentation.
11. Auto Feature button - This button opens the Auto Feature dialog box for the Auto feature icon shown on the button. From the dialog box, you can select a feature command to insert into the measurement routine.
Click the small black arrow to display the Auto Feature toolbar:

For details, see "Inserting Auto Features" in the "Creating Auto Features" chapter in the PC-DMIS Core documentation.
12. Constructed Feature button - This button opens the Constructed Feature dialog box for the constructed feature icon shown on the button. From the dialog box, you can select a feature command to insert into the measurement routine.
Click the small black arrow to display the Constructed Feature toolbar:

For details, see "Constructing New Features from Existing Features: Introduction" in the "Constructing New Features from Existing Features" chapter in the PC-DMIS Core documentation.
13. Dimension button - This button opens the Dimension dialog box for the dimension icon shown on the button. From the dialog box, you can select a dimension command to insert into the measurement routine.
Click the small black arrow to display the Dimension toolbar:

For details, see "Dimensioning Location" in the "Using Legacy Dimensions" chapter in the PC-DMIS Core documentation.
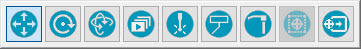
14. Alignment button - Click this button to perform the alignment shown on the button. The alignment options are defined based on the types of features selected, the order in which you select the features, and the positions of the features relative to each other.
Click the small black arrow to display the Alignment toolbar:
For information on alignments, see the "Creating and Using Alignments" chapter in the PC-DMIS Core documentation.
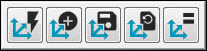
15. Copy/Paste button - This button provides standard copy and paste functions for editing your measurement routine in the Edit window. The button also provides the ability to define and paste patterns of features into your measurement routine.
Click the small black arrow to display the Copy/Paste/Pattern toolbar:
For details, see these topics in the PC-DMIS Core documentation:
"Copy" and "Paste" in the "Using Standard Edit Commands" chapter
"Paste with Pattern" in the "Editing Patterns of Features" chapter
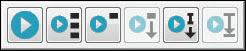
16. Path button - This button performs the path function shown on the button.
Click the small black arrow to display the Path toolbar:
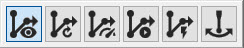
The Path toolbar contains these options:
 Path Lines
- This button shows or hides the path lines on the part in the Graphic
Display window.
Path Lines
- This button shows or hides the path lines on the part in the Graphic
Display window.
(For more information, see "Viewing
Path Lines" in the "Using
Other Windows, Editors, and Tools" chapter of the PC-DMIS Core
documentation.)
 Regenerate
Path - This button regenerates the path lines.
Regenerate
Path - This button regenerates the path lines.
(For more information, see "Regenerating
the Path" in the "Editing
the CAD Display" chapter of the PC-DMIS Core documentation.)
 Path
Optimizer - This button optimizes the path. To do this, PC-DMIS
re-orders commands in your Edit window.
Path
Optimizer - This button optimizes the path. To do this, PC-DMIS
re-orders commands in your Edit window.
(For more information, see "Optimizing
the Path" in the "Editing
the CAD Display" chapter of the PC-DMIS Core documentation.)
 Animate
Path - This button shows an animated probe that takes hits on the
CAD model in the Graphic Display window.
Animate
Path - This button shows an animated probe that takes hits on the
CAD model in the Graphic Display window.
(For more information, see "Animating
the Path" in the "Editing
the CAD Display" chapter of the PC-DMIS Core documentation.)
 Quick
Path - This button turns on the options in the list below. When
you turn on these options, they work together to improve your experience
with Quick Features. (For information on QuickFeatures, see "Creating
QuickFeatures" in the "Creating
Auto Features" chapter of the PC-DMIS Core documentation.) As
you select features, PC-DMIS performs the path generation, and you don't
need to deal with manually creating path commands (such as tips or moves
commands).
Quick
Path - This button turns on the options in the list below. When
you turn on these options, they work together to improve your experience
with Quick Features. (For information on QuickFeatures, see "Creating
QuickFeatures" in the "Creating
Auto Features" chapter of the PC-DMIS Core documentation.) As
you select features, PC-DMIS performs the path generation, and you don't
need to deal with manually creating path commands (such as tips or moves
commands).
Operation
| Graphic Display Window | Clearance Moves | With Feature Creation
(For information, see the "With Feature Creation" subtopic
in "Inserting
Clearance Moves Automatically" in the "Inserting
Move Commands" chapter of the PC-DMIS Core documentation.)
Operation
| Graphic Display Window | Clearance Moves | With Collision Detection
(For information, see the "With Collision Detection" subtopic
in "Inserting
Clearance Moves Automatically" in the "Inserting
Move Commands" chapter of the PC-DMIS Core documentation.)
The Auto Wrist button that's on the Auto Feature bar in the Measurement Properties area of the Auto Feature dialog box. (For information, see "Auto Wrist" in the "Creating Auto Features" chapter of the PC-DMIS Core documentation.)
If you click Quick Path again to disable it, the above options return to the state they were in before Quick Path turned them on.
With Quick Path, PC-DMIS automatically draws path lines from the previous feature to the current feature:
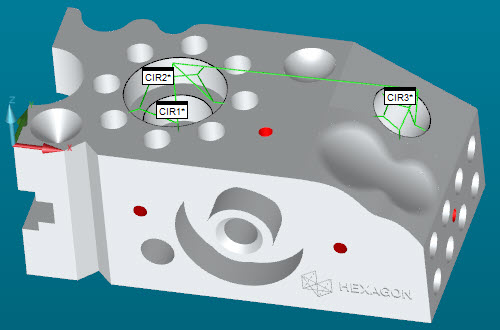
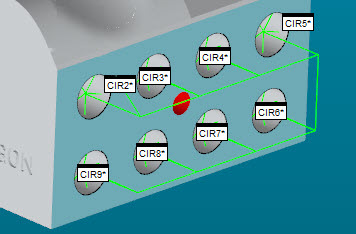
In addition, for patterns of features with QuickFeatures, PC-DMIS draws path lines between the features in the pattern:
 Auto Wrist
- This button turns on or off the Auto Wrist
button that's on the Auto
Feature bar in the Measurement Properties
area of the Auto Feature dialog box.
Auto Wrist
- This button turns on or off the Auto Wrist
button that's on the Auto
Feature bar in the Measurement Properties
area of the Auto Feature dialog box.
17. Mark button - Depending on the selection made on the Mark toolbar, the button marks the currently-selected feature, marks all features, or clears all marked features in the Edit window.
Click the small black arrow to display the Mark toolbar:
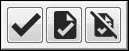
For more information, see "Edit Window Toolbar" in the "Using Toolbars" chapter in the PC-DMIS Core documentation.
18. Execute button - This button runs (or executes) the measurement process for any currently marked feature or features.
Click the small black arrow to display the Execute toolbar:
For details on the functions of the individual buttons, see "Executing Measurement Routines" in the "Using Advanced File Options" chapter in the PC-DMIS Core documentation.
19. Snapshot button - This button inserts a SNAPSHOT command of the current Graphic Display window state into the Edit window. When you execute this command, it inserts an image capture at that state into your report. For more information see "Inserting Snapshots" in the "Inserting Report Commands" chapter in the PC-DMIS Core documentation.
20. Status Window - This button opens the Status window. You can use this window to preview commands and features while you create them from the Quick Start toolbar. You can do this during feature execution, dimension creation or editing, and by clicking the item in the Edit window with the Status window open. For details, see "Using the Status Window" in the PC-DMIS Core documentation.
21. Report Window - This button opens the Report window. After execution of the measurement routine, this window displays your measurement results and automatically configures the output according to a default report template. For detailed information, see "About the Report Window" in the "Reporting Measurement Results" chapter in the PC-DMIS Core documentation.