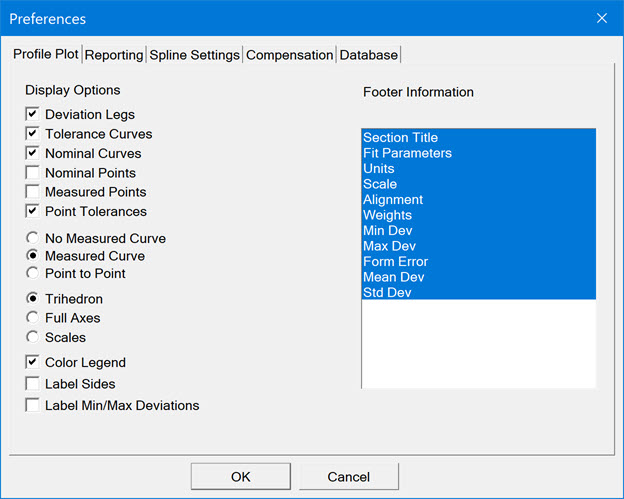

Preferences dialog box - Profile Plot tab
Display Options
Select the options or check boxes to display the elements in the profile plot.
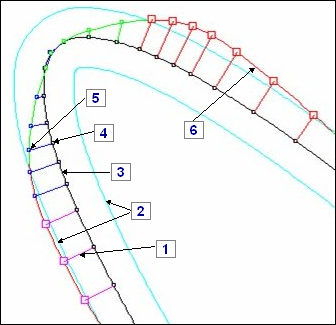
Contour plot elements
Deviation Legs - Lines displayed between the nominal and the measured points.
Tolerance Curves - Displays the profile lines beyond which measured values are considered out of tolerance.
Nominal Curves - Displays the nominal profile for the measured blade section.
Nominal Points - Is the location of the nominal value. A small square specifies the location.
Measured Points - Is the location of the actual measured value. A square with the deviation color as specified on the Reporting tab.
No Measured Curve, Measured Curve, and Point to Point options - Specify how the measured curve displays:
No Measured Curve - Removes the measured curve.
Measured Curve - Displays the curve.
Point to Point - Displays the measured curve as a polyline. A straight line connects the adjacent points.
Point Tolerances check box - Applies to blades that have tolerances assigned to individual nominal points. This check box draws a line perpendicular to the nominal curve at the point that connects the lower tolerance to the upper tolerance.
Point tolerances display only when they play a role in the analysis. When they are available (that is, when you select the Nominal option in the Zone Form list to customize the Flavor file), they look like the blue lines that are perpendicular to the black nominal curve in the graphic below.
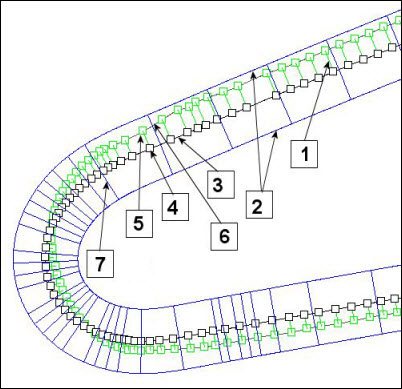
Contour plot elements with point tolerances
1. Deviation legs
2. Tolerance curves
3. Nominal curves
4. Nominal point
5. Measured point
6. Measured curve
7. Point tolerance
Select one of the display options:
Trihedron is shown as below:
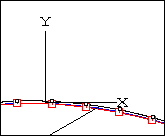
Trihedron option
Full Axes - The X and Y axes are drawn across the page as shown below:
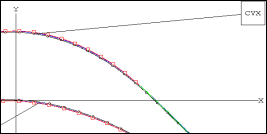
Full Axes option
Scales - The scales on the X and Y axes are shown below:
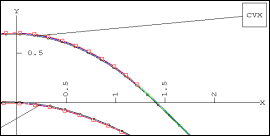
Scales option
Color Legend - This check box determines whether the color legend displays in the header. This legend shows the colors that indicate the Nominal, In Tol (+), In Tol (-), Out of Tol (+), and Out of Tol (-) values.
Label Sides - This check box determines whether the CCV (concave side), CVX (convex side), LE (leading edge), and TE (trailing edge) labels display on the contour plot.
Label Min/Max Deviations - This check box determines whether to place a min and max label next to the min and max profile points.
Footer Information
From the Footer Information list, select the options that you want to include in the footer information. This is a list of values that compute as part of the bestfit used to produce the form plot.
To select more than one option, press Ctrl while you select each option. To select a range of options, select the first option, press Shift, and then select the last option in the range.
More: