The AnalysisWindow object is used to
insert a PC-DMIS Graphical Analysis window into a label template or into
a custom report. Then, in the Report window, PC-DMIS displays a graphical
analysis of dimensions that use a report template, using the label template
with an analysis object in it. 
For information on the Analysis window, see "Inserting Commands Related to the Analysis Window" in the "Inserting Report Commands" chapter.
The AnalysisWindow object only functions with Feature Control Frame dimensions. It does not function with Legacy dimensions.
Manipulating the Object
You can double-click on this object to activate it in the Report window. This lets you manipulate its display in the Report window on the fly. Once activated, you can use your mouse wheel to zoom in or out on the object's graphical display and change its rotation. Double-clicking outside of the object deactivates it. You can also right-click on the object in the Report window to access the Graphical Analysis Options dialog box described below.
If you need to revert a rotated graphical display in the object back to its original orientation, right-click on the object, and select Restore View from the View menu on the shortcut menu. This restores the orientation of the displayed graphical information in the object to its original vector.
Restore View menu item
The other menu items in the View menu, Flip Horizontal and Flip Vertical, flip the horizontal or vertical orientation of the object.
Using with Point Info Boxes in Custom Reports
When adding an AnalysisWindow object to a custom report, you can use the following two properties to control what point information is displayed and how it should look by defining the label template to use:
PointInfoLabel - This property displays a Browse Files dialog box, showing the label templates in your Reporting subdirectory. You can use this dialog box to select the label template you would like PC-DMIS to use when creating Point Info boxes inside of the AnalysisWindow object. Once selected, the property will display the label name and any Point Info boxes that exist within the AnalysisWindow object will be immediately updated.
PC-DMIS remembers the selected template and uses it for subsequent AnalysisWindow objects that are added into the Custom Report editor. The defined template is also stored in the LastUsedPointInfoLabel registry entry under the Reporting section of the PC-DMIS Settings Editor.
If you do not define any label template in this property, any Point Info boxes used are generated the same as if you had dragged a PointInfo object onto the Custom Report editor. In that case, it does not use a label template, but is created internally.
Some label templates to consider using are: ga_point_info.lbl, ga_point_info2.lbl, and ga_point_info_devonly
To clear this property, open the Browse Files dialog box, remove the filename listed in the File name box, and click Cancel.
SelectPointInfo - This property displays the Edit Point Info dialog box. That dialog box allows you to create Point Info boxes inside the AnalysisWindow object's window. This dialog box comes in two different styles depending on whether or not you have a label template defined in the PointInfoLabel property.
If you do not have one defined, then the standard Edit Point Info dialog box appears:
Edit Point Info dialog box
If you do have one defined, then a slightly different Edit Point Info with Label dialog box appears:
Edit Point Info with Label dialog box
These dialog boxes are similar, but if you have defined a label, you can only choose to hide or display leader lines using the Point info format area. This is because the other items do not apply if you are using a customized label template. For information on the available items in either of these dialog boxes, see the "Inserting Point Info Boxes" topic in the "Inserting Report Commands" chapter.
To determine what this object displays, you can modify its many properties. You can also use the (Settings Dialog) property to access the Graphical Analysis dialog box inside the template editor. This dialog box lets you set many of the AnalysisWindow object's properties. There are two tabs:
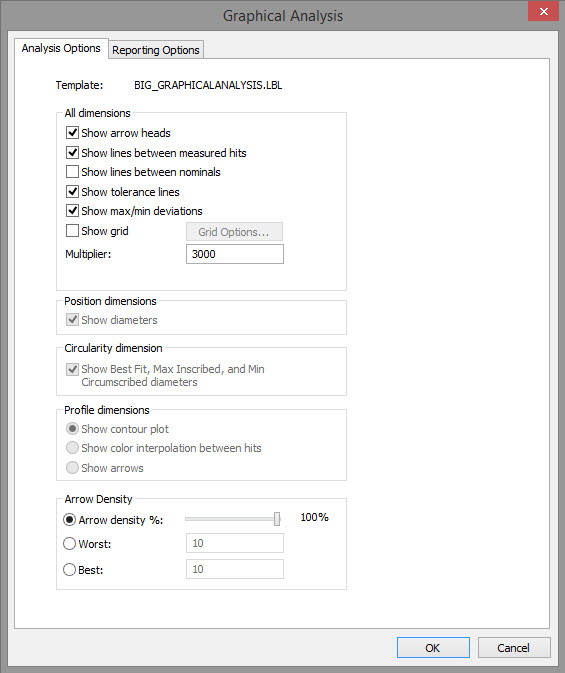
Graphical Analysis dialog box
Analysis Options tab
For a description of the options on this tab, see "Dimension Options" in the "Inserting Report Commands" chapter. (The Template name near the top of the tab only appears if you edit an AnalysisWindow object within the Report window. For information on editing directly within the Report window, see "Edit Graphical Analysis".)
For a description of the options on this tab, see the corresponding properties under the "Available Properties" subtopic below.
Here are the properties that are tied to the options on this tab:
Line color (measured) - see "MeasuredLineColor"
Line style (measured) - see "MeasuredLineStyle"
Line color (nominal) - see "NominalLineColor"
Line style (nominal) - see "NominalLineStyle"
Line style (deviation) - see "DeviationLineStyle"
Show trihedron - see "TrihedronShow"
Min/Max ball size - see "MaxMinSize"
Minimum ball color - see "MinColor"
Maximum ball color - see "MaxColor"
Background color - see "BackColor"
Leaderline termination - see "LeaderTermination"
Show Deviation - see "DeviationShow"
Show Title - see "TitleShow"
Show Border - see "BorderShow"
Line Size - see "PenWidth"
The available properties for this object are listed below:
All properties are used in Custom Reports unless otherwise stated. Those properties followed by an asterisk (*) are also used in Report Template Builder.
(Settings
Dialog) *
Displays the Graphical Analysis Options dialog
box for the selected AnalysisWindow
object.
Arrow Best Value
Defines the number of best deviations for which to display arrows.
Arrow Density Options
Determines how to handle arrow density.
0 - by Percent - This uses the percentage defined in the Dimension Analysis Options dialog box's Arrow density slider.
1 - by Worst - This uses the Arrow Worst Value property.
2 - by Best - This uses the Arrow Best Value property.
Arrow Worst Value
Defines the number of worst deviations for which to display arrows.
ArrowHeads *
Same as the Show Arrow Heads check box in the
dialog box.
AutoScaleToFit
Scales the information being analyzed so it fits within the boundaries
of the object.
BackColor *
Common Properties
BorderShow *
Shows or hides the AnalysisWindow
object's border.
Bottom *
Common Properties
CadNominalStepValue
This defines the density of the points projected along the polyline to
the CAD interpolation for the points inserted from the CAD model in the
GenerateCadNominal
property.
CircularityMaxMinDiameters *
Same as the Show Best Fit, Max Inscribed, and Min Circumscribed Diameters check box in the dialog
box.
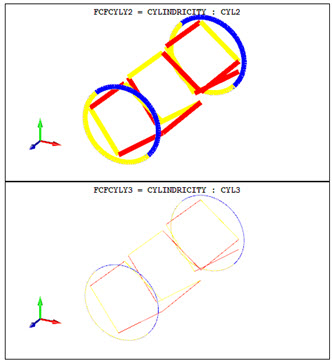
DeviationLineStyle
Defines the deviation line style.
Cylinder - Deviation lines are drawn as a cylinder terminated with an arrowhead.
Line - Deviation lines are drawn as simple lines.
DeviationShow
Shows or hides the deviation lines. By default these are drawn as arrows.
Enable *
Common Properties
GenerateCadNominal
This generates a smoother nominal polyline by projecting additional points
onto the CAD model as needed in order to see a line that more closely
matches the CAD model. The density of these additional points can be increased
or decreased using the CadNominalStepValue
property.
GridShow *
Displays the 3D grid-like backdrop for the Analysis window.
LabelOffset
This positions a user-defined Point Info label at the specified offset
distance from the hit location. The label to use is defined in the PointInfoLabel
property.
LeaderTermination
Sets the termination location for any leader lines between Point Info boxes
and their associated point locations:
End of Arrow - The leader lines point to the end-of-arrow locations.
Nominal - The leader lines point to the nominal point locations.
Measured - The leader lines point to the measured point locations.
Left *
Common Properties
MaxColor
Determines the sphere point color for maximum deviations. The default is
red (0.0.225).
MaxMin *
Same as the Show Max/Min Deviations check box
in the dialog box.
MaxMinSize
Determines the diameter of the sphere point that marks the Max/Min points
in the AnalysisWindow
object. The default is 0.
MeasuredLineColor
When lines are displayed between the measured hits, this determines the
line color used.
MeasuredLineStyle
When lines are displayed between the measured hits, this determines the
style used. You can choose Solid or Dashed.
MinColor
Determines the sphere point color for minimum deviations. The default is
blue (255.0.0).
NominalLineColor
Determines the color of the nominal graphical line.
NominalLineStyle
Determines the style of the nominal graphical line. You can choose Solid or Dashed.
PC-DMIS
Command Objects
Common Properties
PC-DMIS
Reference
Common Properties
PenWidth
Sets the line size for the lines in the analysis object. The default is
0. The maximum line width is determined by your graphics card and driver.
PenWidth of 8 (top), and 0 (bottom)
PointInfoLabel
Selects the label template to use for Point Info boxes tied to the AnalysisWindow object. Use-defined
labels in this object cannot be moved except by using the LabelOffset
property.
ProfileMeasured *
Same as the Show Lines Between Measured Hits
check box in the dialog box.
ProfileNominal *
Same as the Show Lines Between Nominals check
box in the dialog box.
ProfileOptions *
Same as selecting one of the option buttons from the Profile
Dimensions area in the dialog box.
ProfileTolerances *
Same as the Show Tolerance Lines check box in
the dialog box.
Right *
Common Properties
RulerElemX
Same as Number of elements XYZ boxes discussed
in the Analysis Grid Options dialog box.
RulerElemY
Same as Number of elements XYZ boxes discussed
in the Analysis Grid Options dialog box.
RulerElemZ
Same as Number of elements XYZ boxes discussed
in the Analysis Grid Options dialog box.
Scale
Scales the Analysis window by a specific ratio. The format is n1:n2 where
n1 and n2 are two numbers. For example, a value of 1:3
would display the info in the Analysis window at three times its normal
size, and a value of 2:1 would display
the info at half its normal size. The property also displays the current
zoom ratio if you zoom using the mouse buttons.
The AutoScaleToFit property must be set to No for the Scale property to work.
SelectPointInfo
Displays a dialog box so you can select the point information to display
in Point Info boxes in the AnalysisWindow object.
TitleShow *
Shows or hides the text of the items being dimensioned at the top of the
AnalysisWindow
Object.
Top *
Common Properties
TPDiameters *
Same as the Show Diameters check box in the dialog
box.
Transparent
Disables any color defined in the BackColor
property and makes the object transparent, showing other
objects behind it.
TrihedronShow
Shows or hides the trihedron symbol. Alternately, you can select Ruler to show a ruler along each axis.
Visible *
Common Properties